Preparing for MassDestruction - July 2026
Project link
github.com/Woz4tetra/auto-battlebot
Background
Our next combat robot event is MassDestruction in Waltham MA: https://massd.io/massd-resurgence-six-aug-26/
We’ve wanted to go for a few years now and finally signed up on time. It’s happening at the end of August. Since this is happening relatively soon after our May event, improvements we make will be iterative and not generational. For this blog post, I will focus on the improvements I made to the detection models.
Per our last event (May 2026 recap), I concluded that this approach works:
- Handheld autonomy device
- YOLO26 pose for Mrs Buff MK3
- YOLO26 seg for other robots
- Deeplab for field localization + ZED Visual SLAM for handheld tracking
- PID as control
However, I didn’t have a clear idea as to whether I trained the models optimally or if another model format would work. I also didn’t know if any changes I made improved model performance or not. I need a scoring system.
Stretch goals:
- Improve filtering coming out of the models
- More sophisticated navigation to cancel out the system latency
Out of scope:
- Trying alternative models to YOLO or Deeplab
- Compute or sensing hardware changes
Scoring models
To test if I was making progress, I needed a set of tests to put numbers to model performance.
Establish ground truth
The first step was to establish ground truth. I labeled ~500 images from our May 2026 NHRL event with keypoints and the following categories:
- Robot (opponent)
- Mrs Buff MK3
- House bot
Technically “object” and Mr Stabs MK2 are available categories but they aren’t present in this dataset.
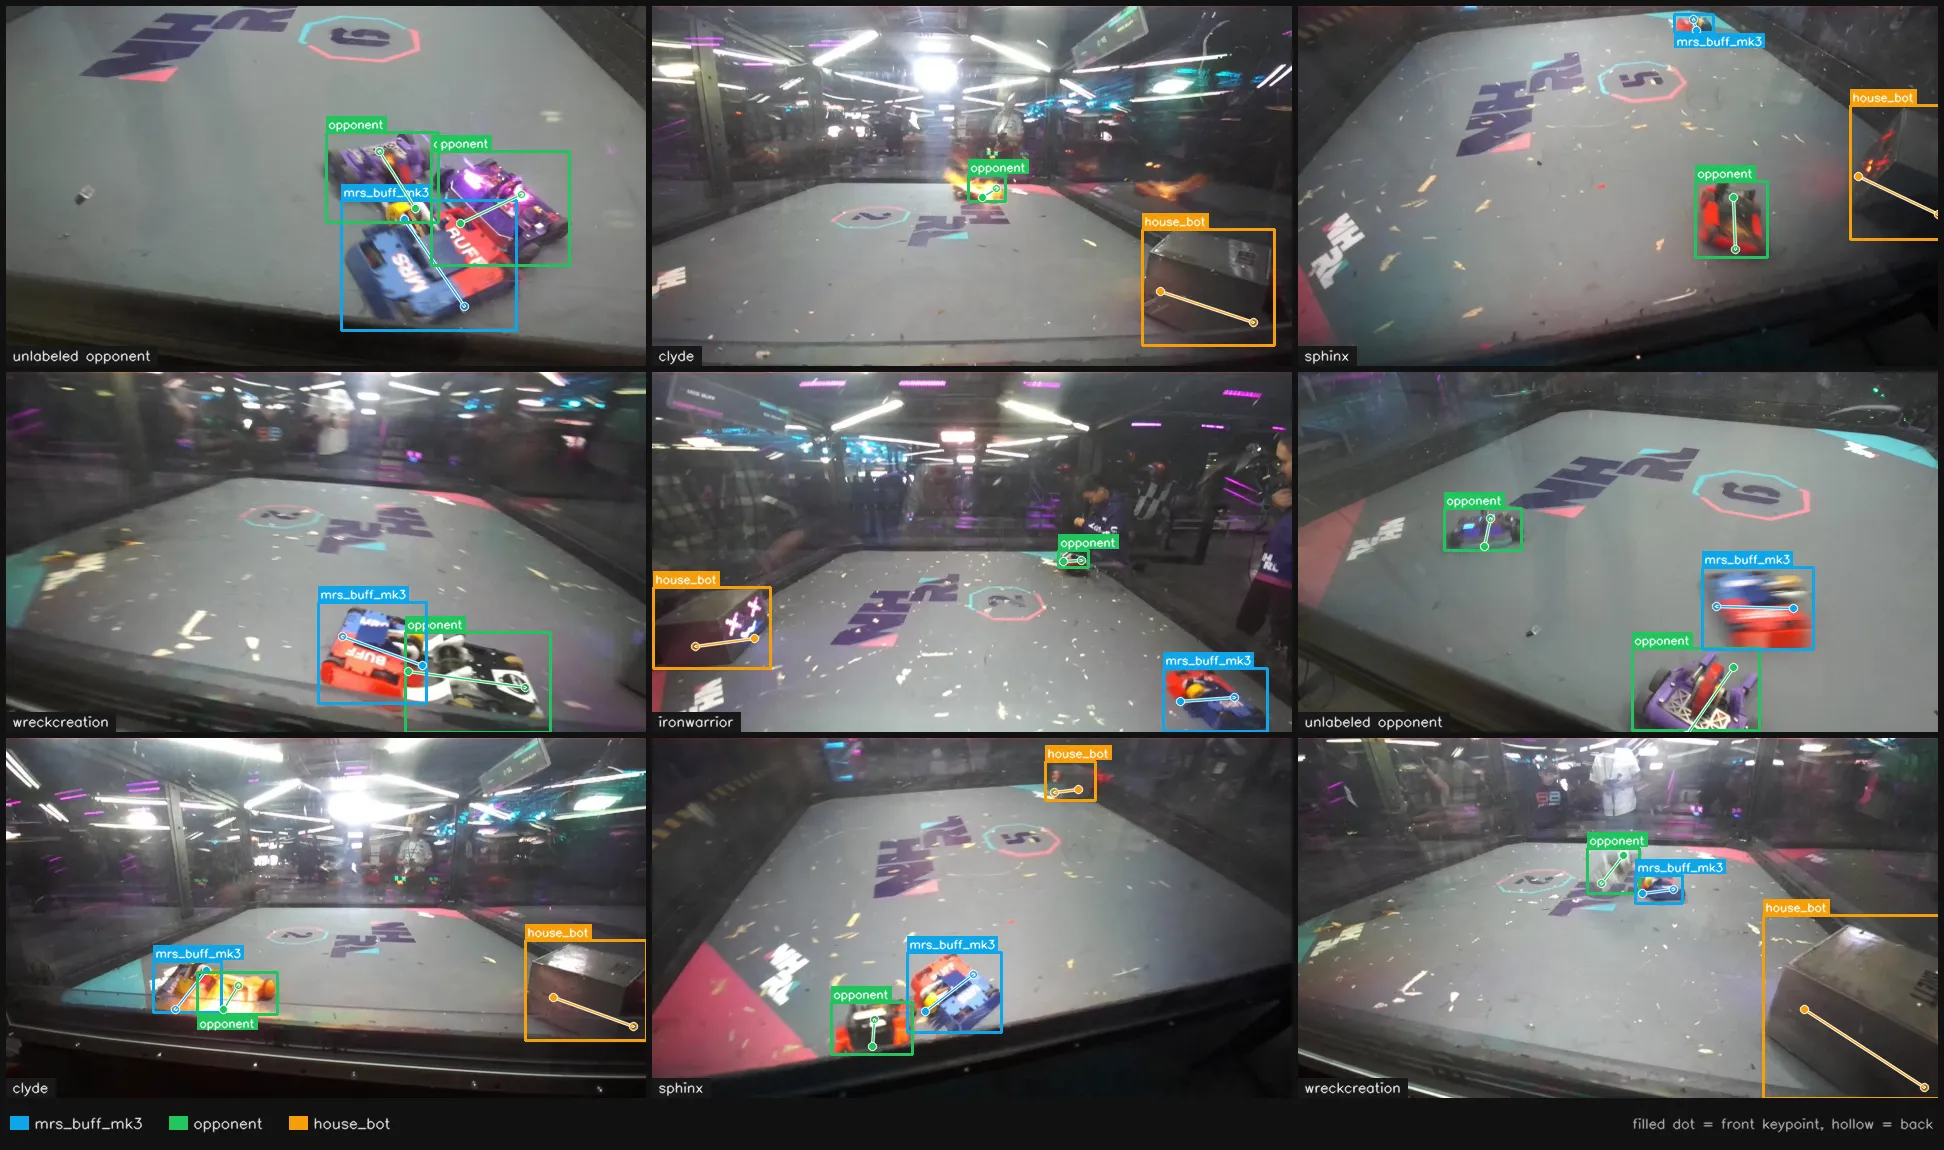
I considered labeling every frame of the recordings by running the detection model and correcting the errors. The error rate however was high enough that I would rather just label them myself. Fixing the errors took longer. Here’s a sample of the ground truth dataset that I labeled by hand:
Generating the ground truth data set
I record images to SVO files (a ZED camera generated file that wraps the MCAP format). I run make_eval_dataset.py
python training/model_eval/make_eval_dataset.py \
    data/recordings/auto_battlebot_main_<...>__<...>.mcap \
    --per-video 100
Then I label the images manually with the edit_labels.py tool:
python training/model_eval/edit_labels.py \
    training/data/nhrl_keypoints_eval_test/<recording>
It’s also useful to extract the camera transforms that were computed during the fight. To generate that
metadata I run export_camera_transforms.py =
(it automatically figures out metadata association based on data in training/data/nhrl_keypoints_eval_test)
python training/model_eval/export_camera_transforms.pyI run an integrity that checks for label alignment and missing annotations:
python training/yolo/validate_yolo_integrity.py training/data/nhrl_keypoints_eval_testAnd finally, I look at every image and confirm the images were annotated correctly. I go back and fix them if I encounter issues.
python training/yolo/validate_yolo_dataset.py training/data/nhrl_keypoints_eval_testBackground on YOLO
YOLO outputs hundreds of bounding boxes. The vast majority of them have a confidence value below 0.01. If your training data is consistent, the boxes that contain your object will likely have a confidence above 0.5. I’ve found that a model that scores with 0.6 or lower is likely to produce false positives or negatives. However, there are ways to quantify this across a dataset.
There are several types of YOLO models. The ones used in this report are:
- Bounding box - the base model
- Instance segmentation mask
- Keypoints
Both the keypoints and seg-mask version of YOLO output bounding boxes. They have seg-masks or keypoints as an additional model output. I scored all of these in various tests. I mostly tested the bounding box model.
YOLO also has many releases. I’m using YOLO26 which is the latest release at the time of writing. There are even different network sizes within each YOLO release (yolo26n, yolo26s, yolo26m, yolo26l, yolo26x). I chose the latest model since it offers the best accuracy in Ultralytics benchmarks and similar latency performance. I didn’t have time to assess the tradeoffs of model size vs. latency. I’ll leave this to a future test.
All experiments in this post use yolo26n, yolo26n-seg, or yolo26n-pose.
Scoring metrics
I scored two things against ground truth:
- Bounding box overlap
- Category correctness
- Keypoint accuracy (when available)
Bounding box scoring
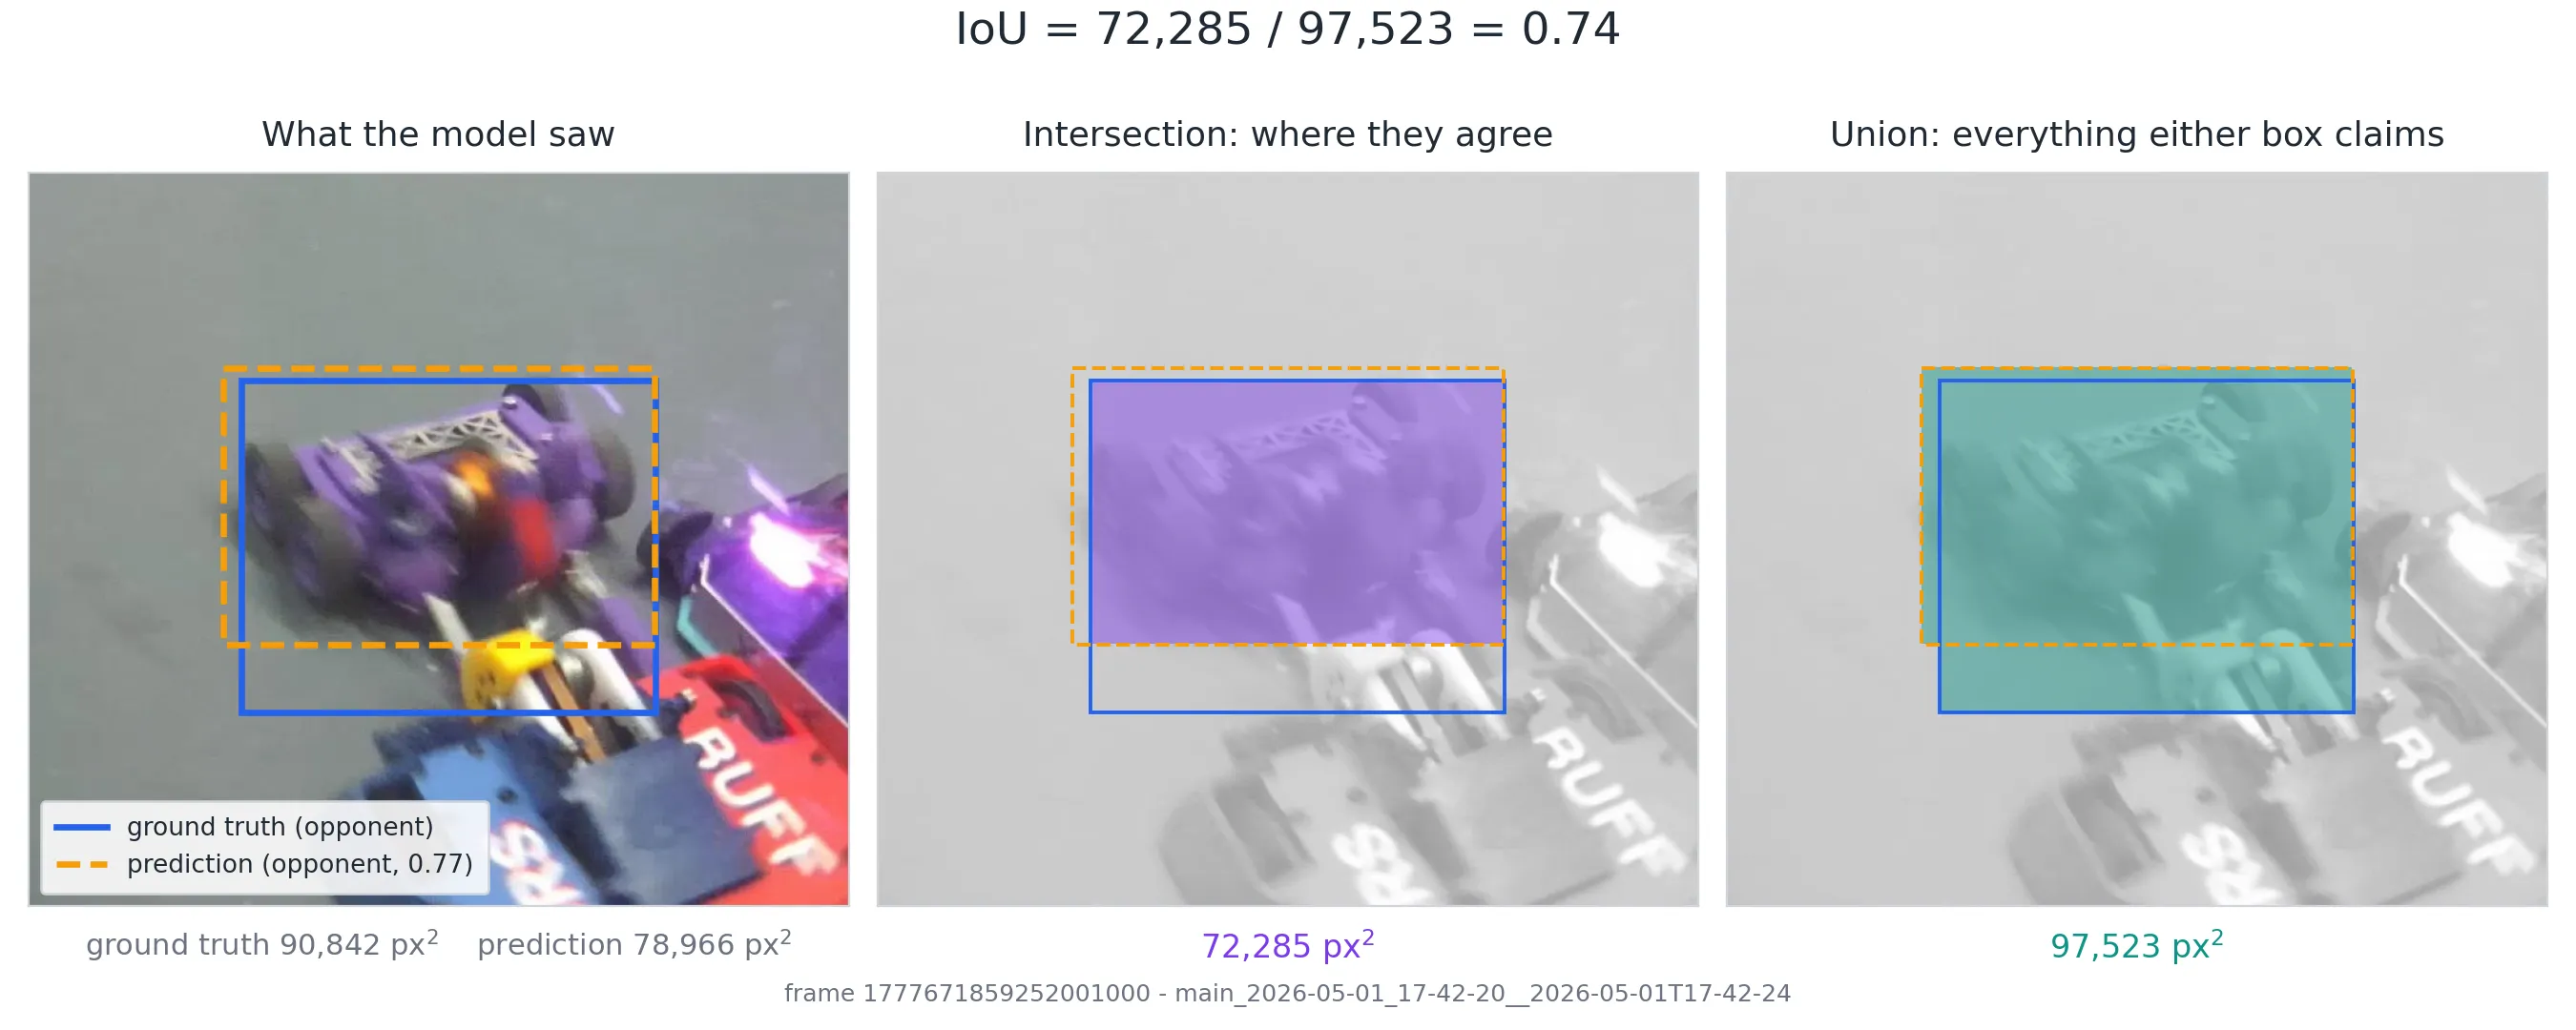
The scoring script sorts the bounding boxes from most to least confident and greedily matches to the ground truth data. For all tests, I ignored bounding boxes with a confidence less than 0.5. Intersection over Union (IoU) is used to match ground truth boxes to model outputs.
IoU = intersection / (area_A + area_B - intersection)
IoU is computed for all ground truth and model output boxes. Pairs with IoU values less than 0.5 are discarded.
For each ground truth box, the highest confidence model output pair is selected.
The collected ground truth-model output pairs are grouped into one of the following categories:
| Bucket | Full name | Description |
|---|---|---|
| TP | True positive | The box matched ground truth and the label is correct |
| CE | Classification error | The box matched a ground truth box but the label is wrong |
| FP | False positive | The prediction match nothing (fired on the background) |
| FN | False negative | Ground truth box matched no prediction from the model (a miss) |
These buckets are summed up over all ground truth annotations and used to compute the final metrics over the full ground truth dataset:
| Metric | Formula | Description |
|---|---|---|
| Precision (P) | TP / (TP + CE + FP) | What fraction of matched model outputs correctly named the robot? |
| Recall (R) | TP / (TP + CE + FN) | What fraction of matched model outputs find all robots present? |
| F1 | 2 * P * R / (P + R) | A blended summary of precision and recall. A single number to compare models by. Only use it as a tiebreaker. |
| Localization Recall | (TP + CE) / (TP + CE + FN) | For all model outputs, how many matched regardless of label? |
| Wrong Class Rate | CE / (TP + CE) | What fraction of correct model outputs got the wrong label? |
| mAP50 | ”Mean average precision” at 0.5 IoU threshold. Loose box quality | |
| mAP50-95 | Average of mean average precision at varying IoU thresholds from 0.5…0.95. Tight box quality |
This wikipedia article has definitions for these terms including F1: https://en.wikipedia.org/wiki/F-score
Low precision means the model is labeling things that aren’t a robot (or mislabeling my robot).
Low recall means the model is not producing box output when it should. This is the most interesting metric in these tests.
For opponent bounding boxes, mAP isn’t a great metric for me since the robots can appear small in the image. This drags the mAP score down a lot. My precision requirements aren’t super strict either. I mostly focus on recall.
These metrics are computed for 3 “levels”:
| Level | Description |
|---|---|
| Agnostic | Every label maps to “robot” |
| Archetype | Labels map through a taxonomy file that routes the model’s output label to something else |
| Instance | Model outputs are compared as-is |
This is the command I used to benchmark the original segmentation mask model used at the May NHRL event:
python training/model_eval/score.py training/data/nhrl_keypoints_eval_test \
    --candidate orig_seg=data/models_v2/yolo26n-seg_nhrl_robots_2026-04-27_x86_64_sm86.engine \
    --labels "object,opponent,house_bot,mr_stabs_mk2,mrs_buff_mk3" \
    --taxonomy training/model_eval/taxonomy_merged.yaml \
    --conf 0.5 \
    --output training/data/nhrl_keypoints_eval_test/scores_orig_vs_2class/orig
This command tests the new model I trained after making improvements:
python training/model_eval/score.py training/data/nhrl_keypoints_eval_test \
    --candidate merged_2class=data/models/yolo26n_nhrl_robots_bbox_2class_2026-07-29_x86_64_sm86.engine \
    --labels "opponent,house_bot" \
    --taxonomy training/model_eval/taxonomy_merged.yaml \
    --conf 0.5 \
    --output training/data/nhrl_keypoints_eval_test/scores_orig_vs_2class/new
These only compare the bounding box outputs of these models. The experiments I’m about to describe detail why I switched from seg-mask to bounding box.
Here’s are the result metrics for the two models scored above and demonstrate the overall results for all the improvements I made based on the experiments I’m about to detail.
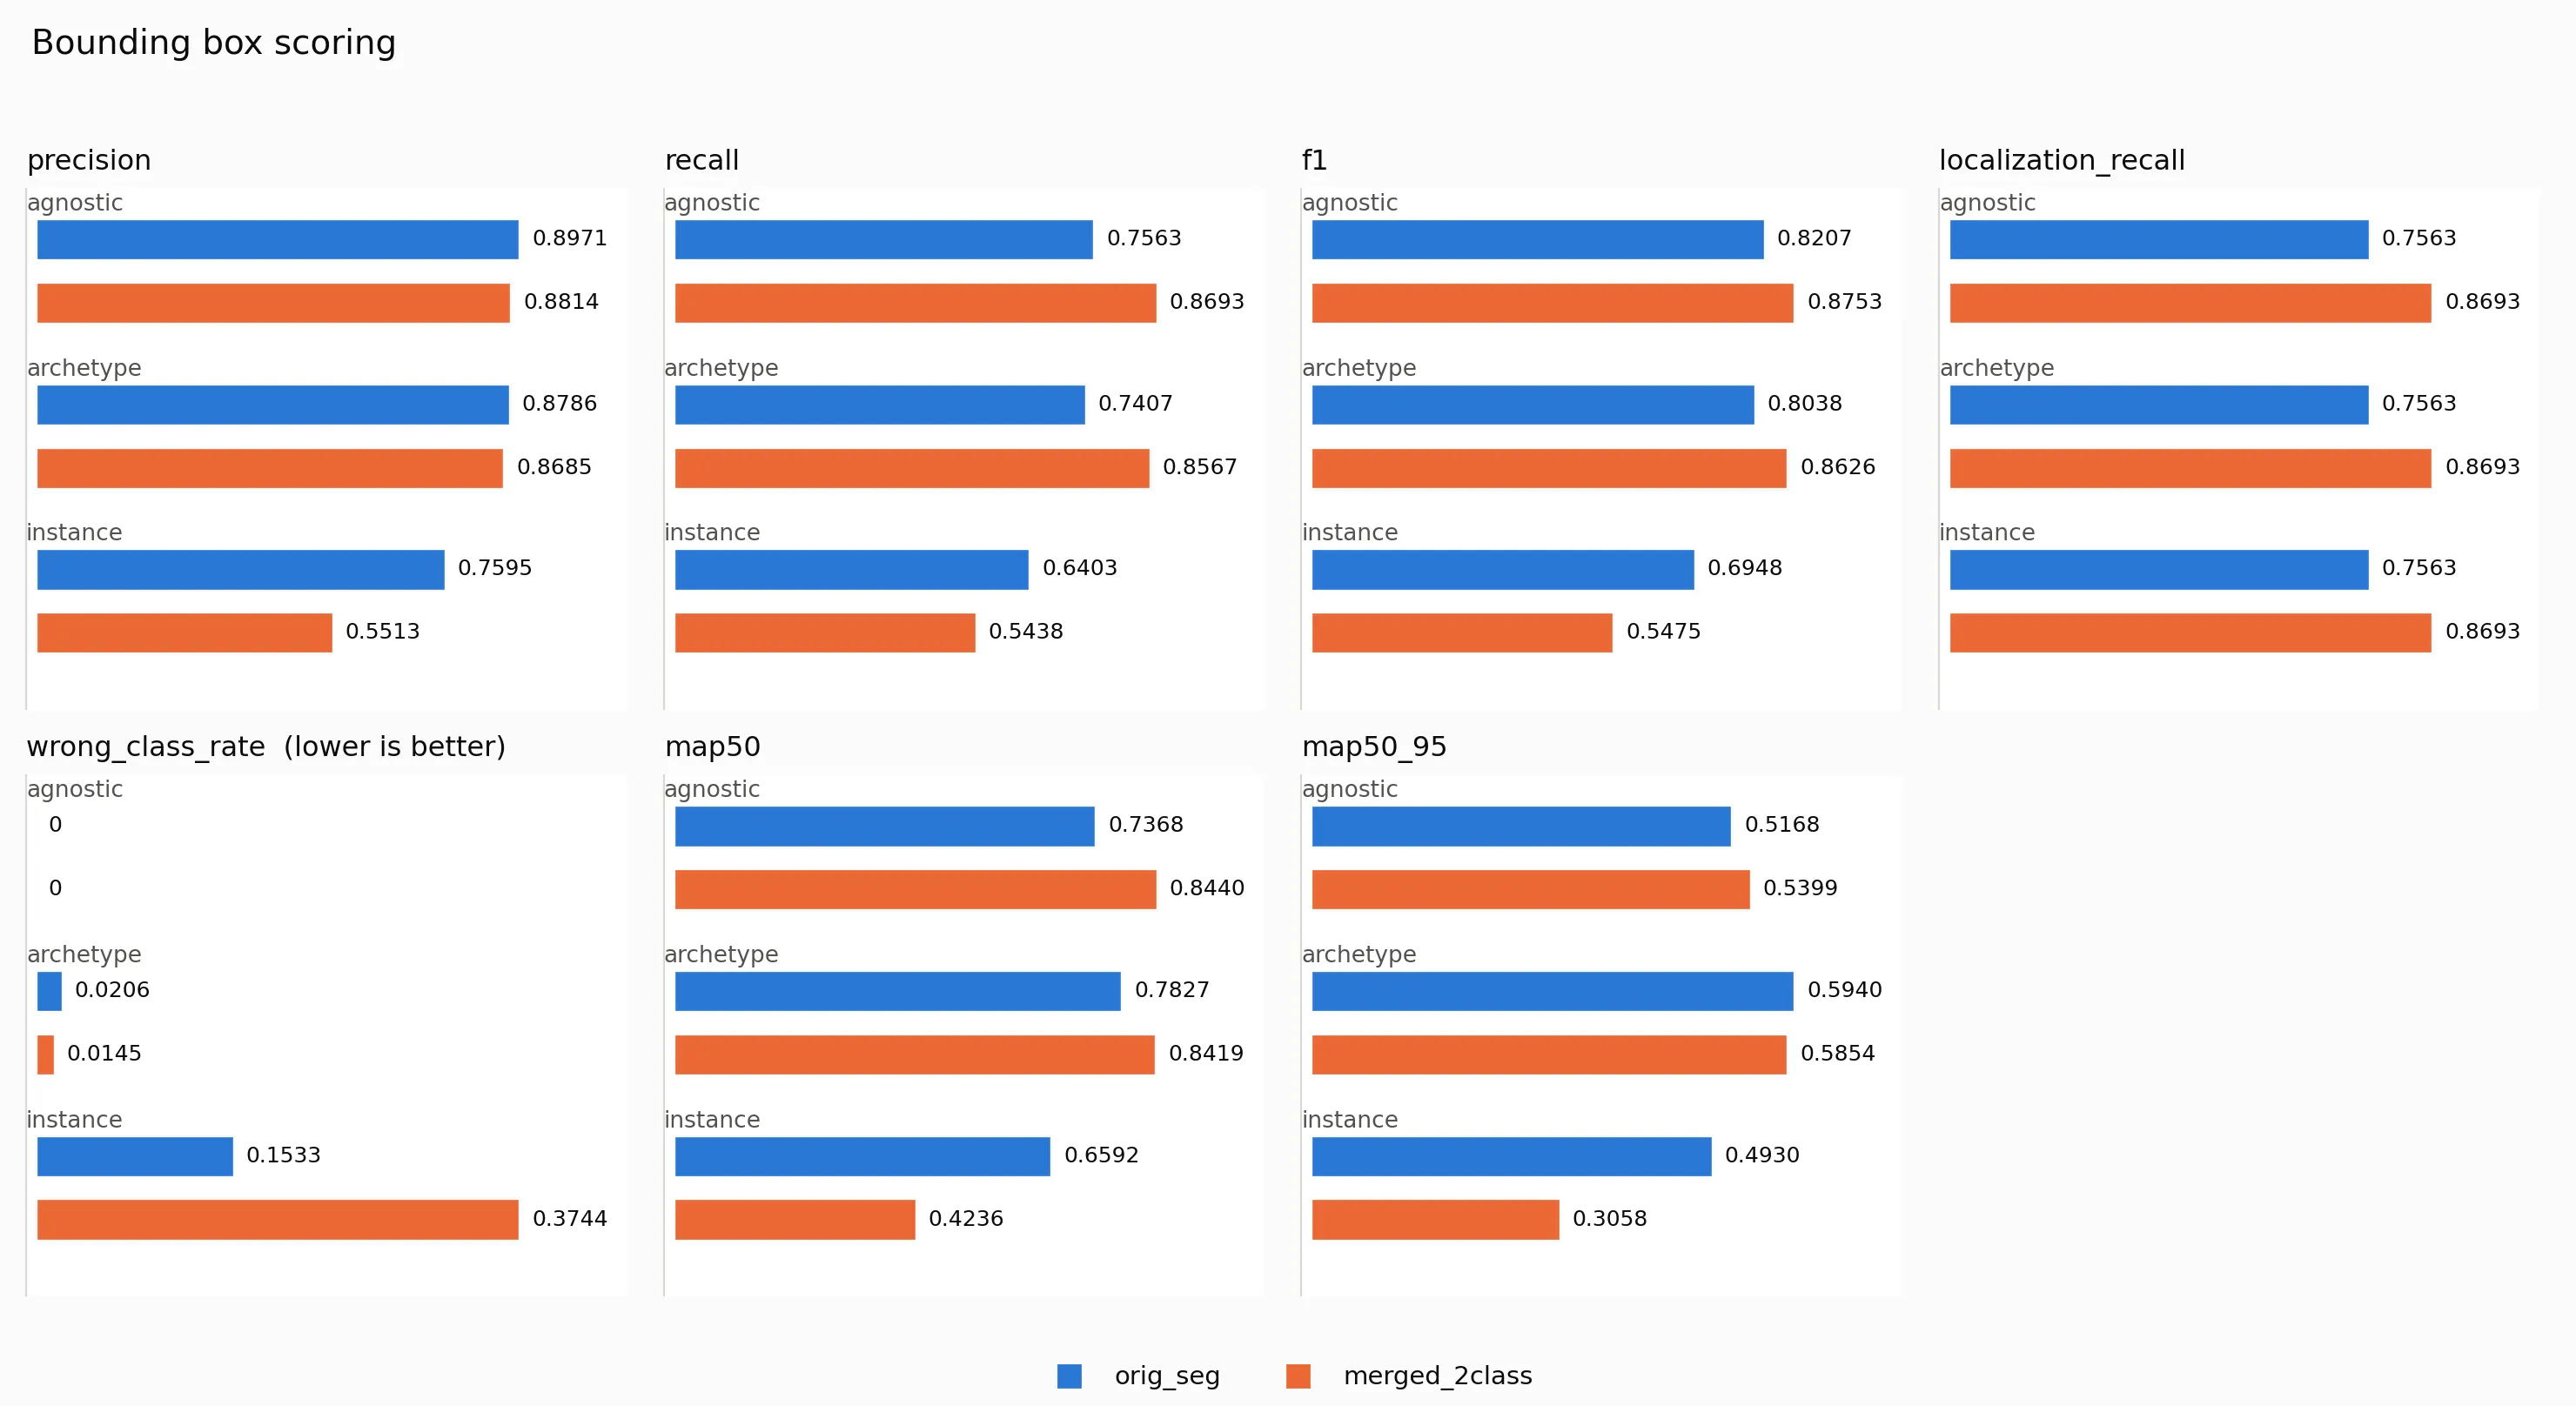
Old model: orig_seg, data/models_v2/yolo26n-seg_nhrl_robots_2026-04-27_x86_64_sm86.engine
New model: merged_2class, data/models/yolo26n_nhrl_robots_bbox_2class_2026-07-29_x86_64_sm86.engine
Keypoint scoring
To score keypoint data I used the following metrics:
- kp_err_px - Average pixel distance error between detection and ground truth
- [email protected] - Fraction of keypoints within a radius of ground truth keypoints. The radius used is 10% of the largest bounding box dimension.
- heading_err_deg - Average heading error
- heading_acc@10deg - Fraction of detections that were within 10 degrees of ground truth
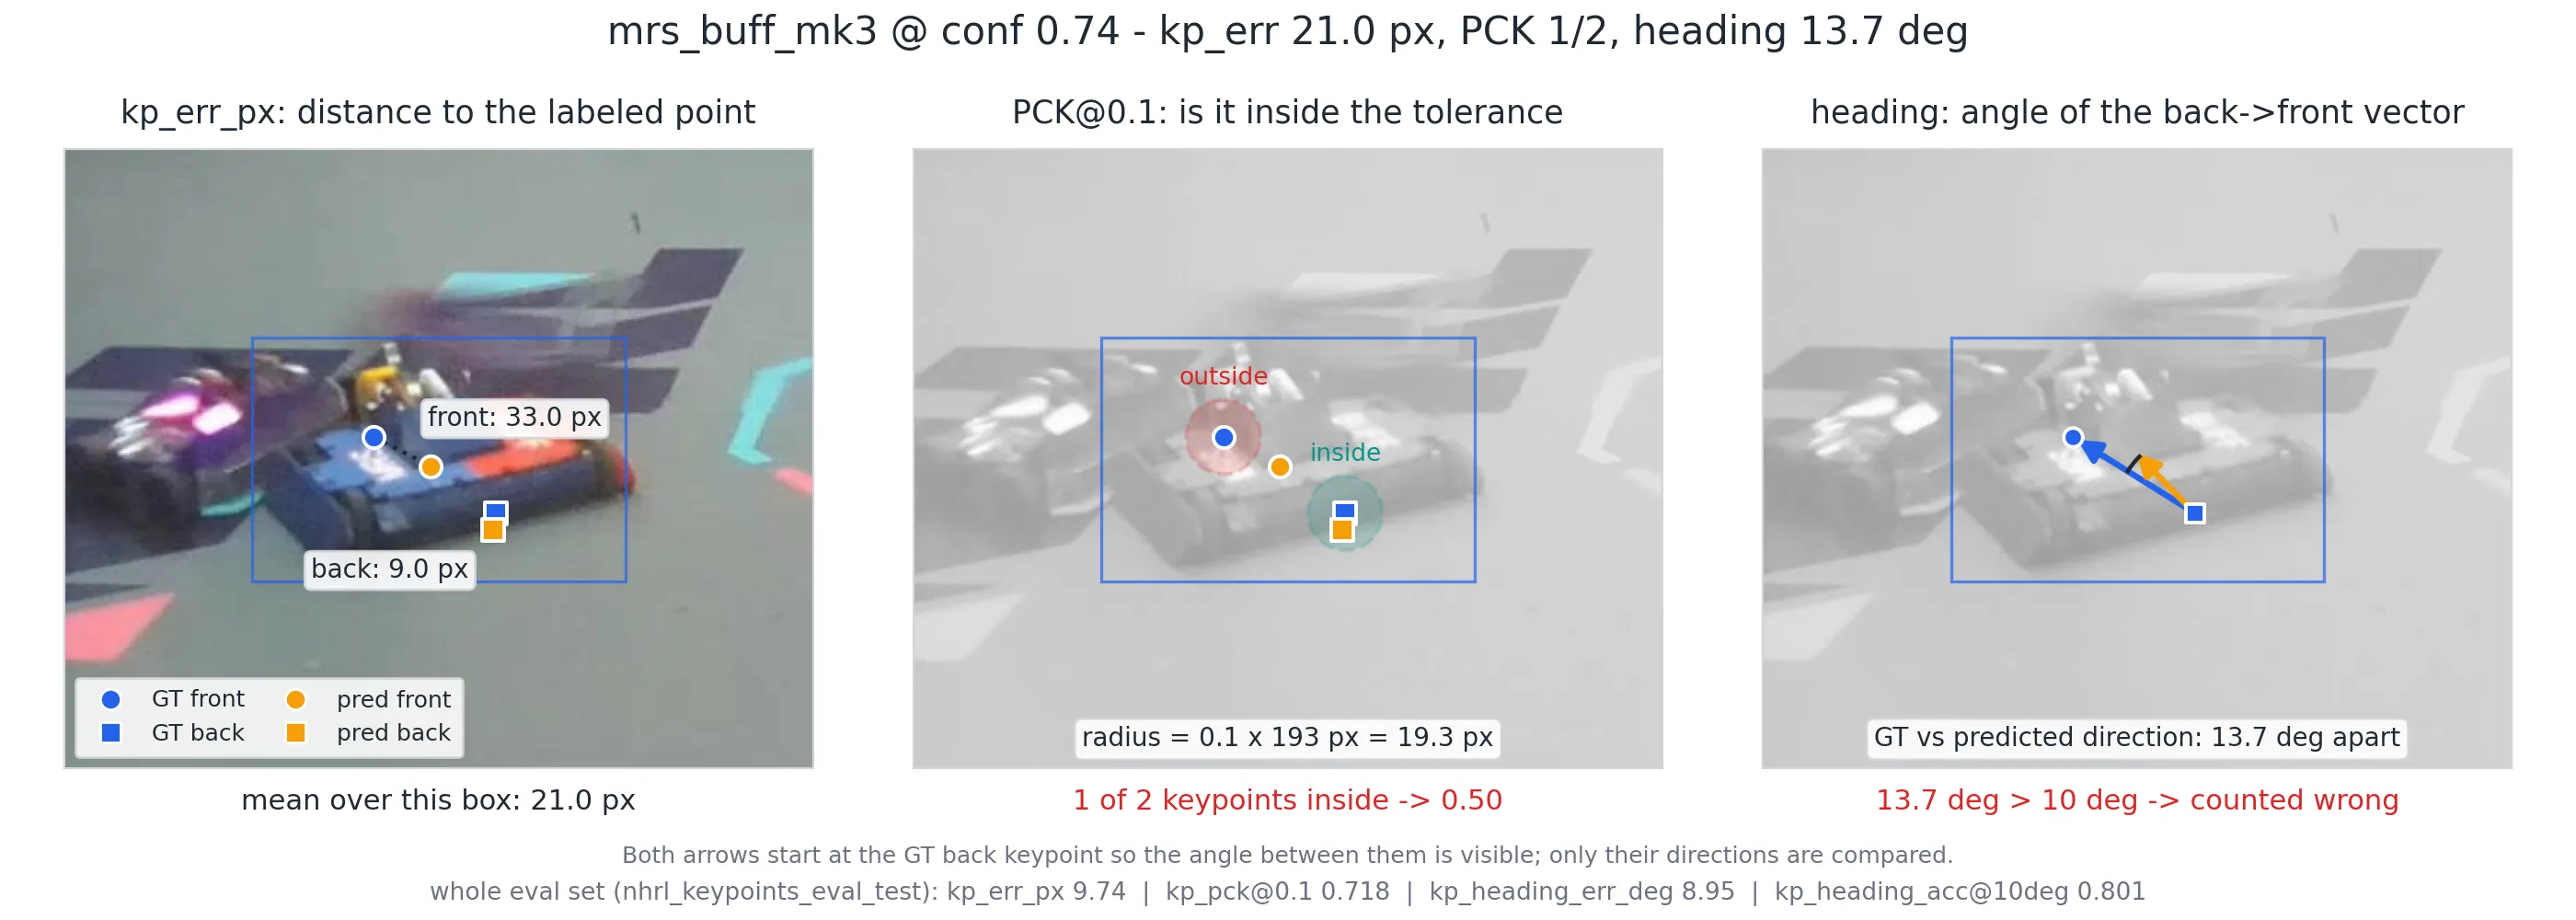
To read more on these metrics here’s some helpful links:
- Ultralytics — YOLO Performance Metrics guide
- Roboflow — What is Mean Average Precision (mAP) in Object Detection?
- PyImageSearch — Intersection over Union (IoU) for object detection
Experiment journey
Now onto the fun part!
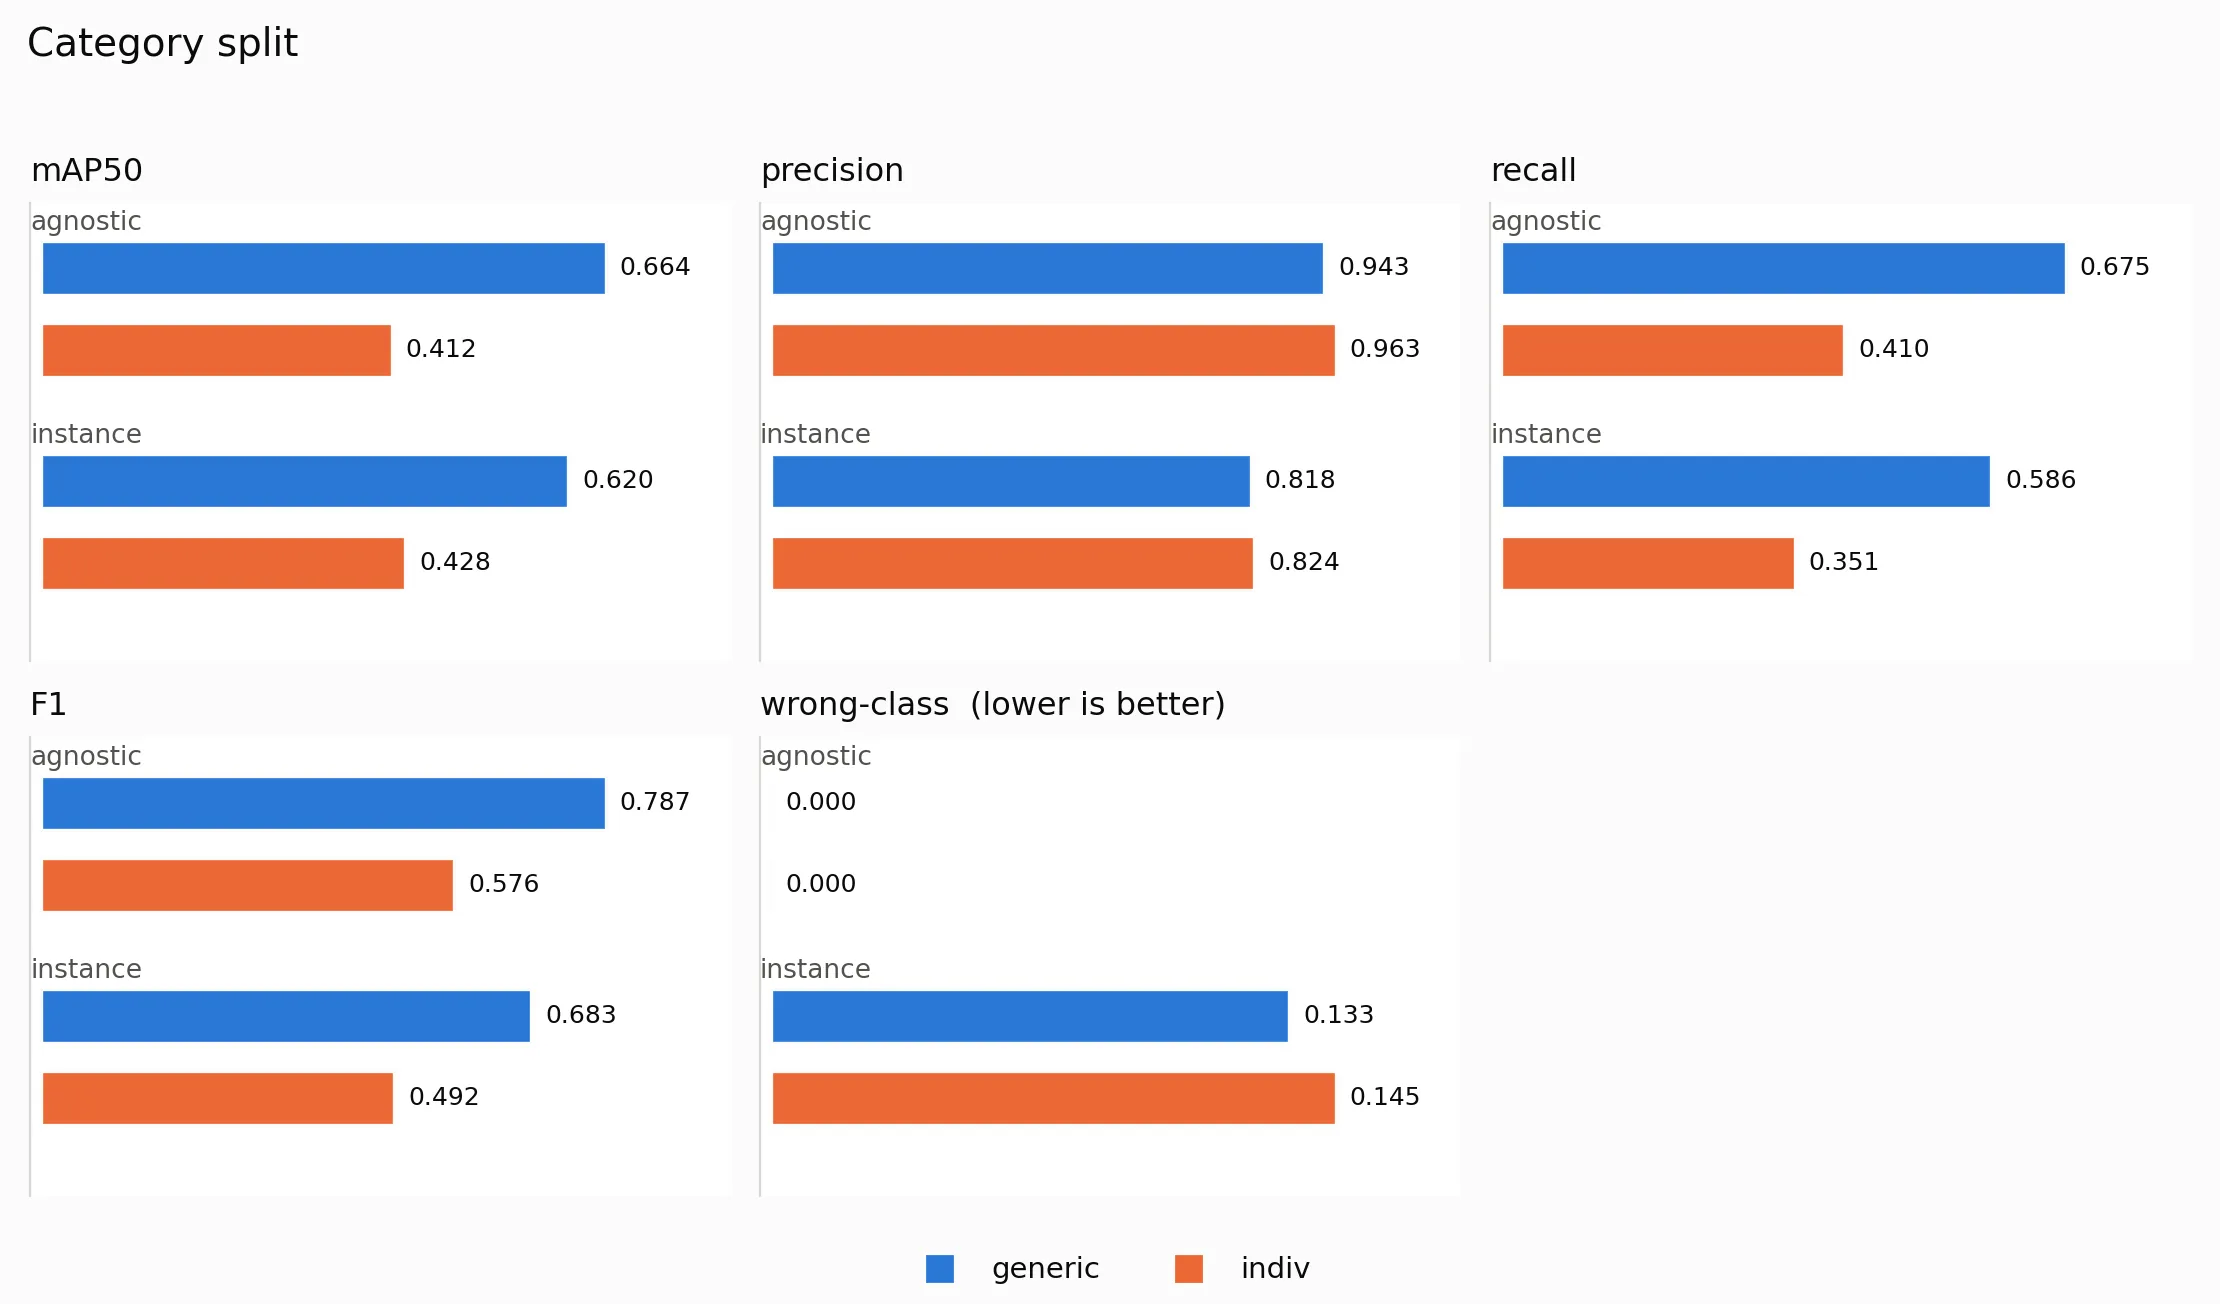
Category split
At the start I had these questions:
- Is it better to lump all NHRL robots into a single category or split them by robot name?
- Does splitting by archetype work?
Short answer: no. It’s better to merge into a single “robot” class.
Here’s the data for the model split by individual robot names against the baseline:
Here’s the data for the model split by 7 archetypes against the baseline:
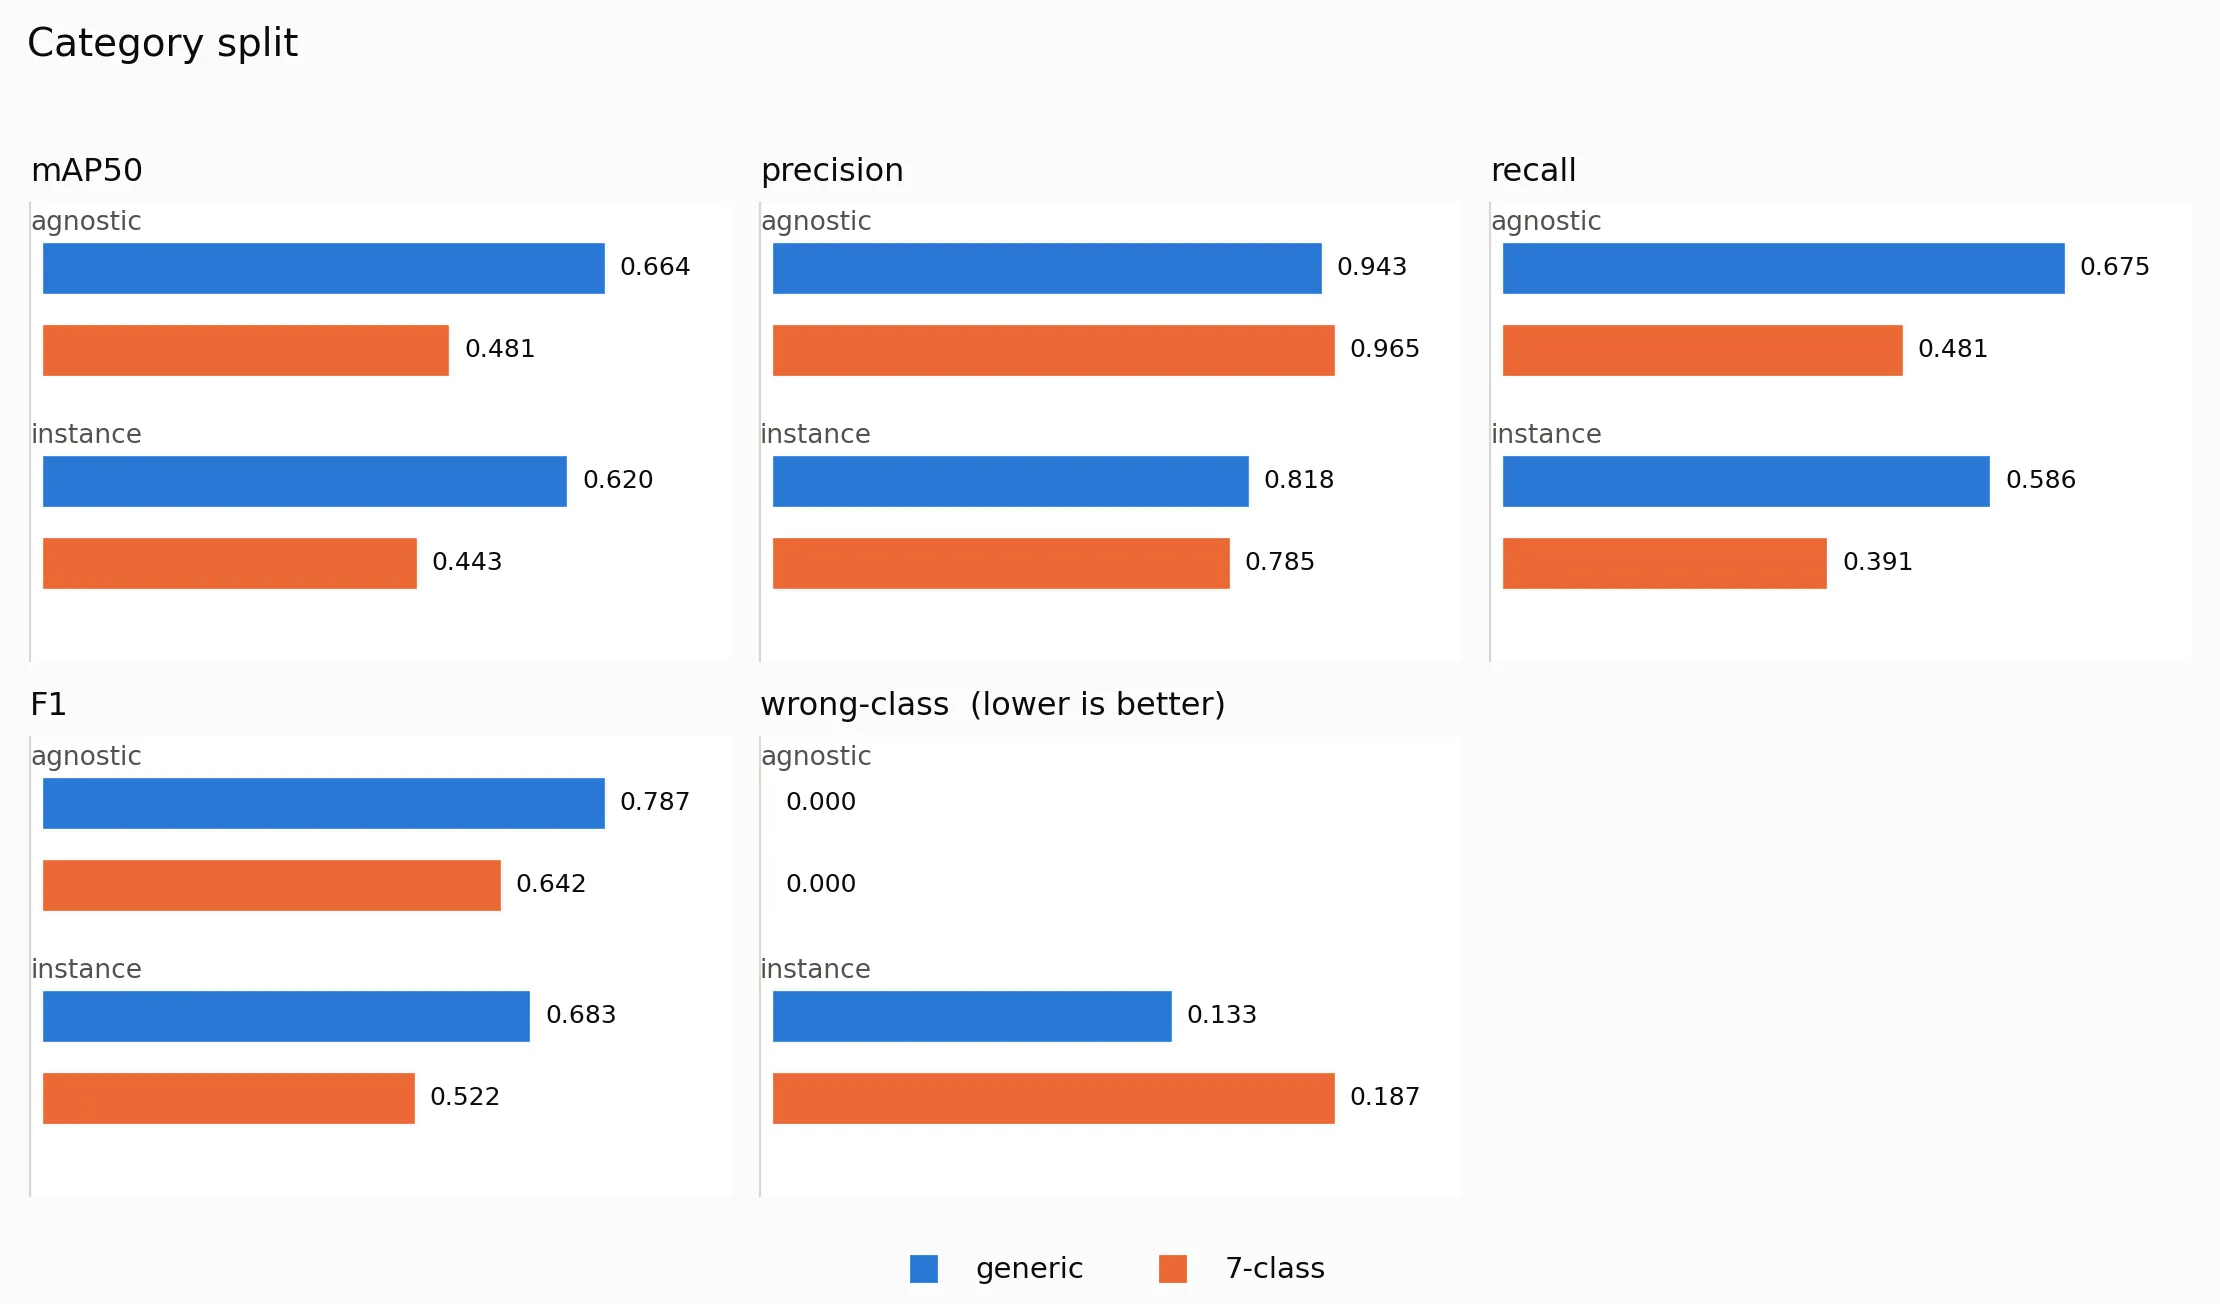
Recall was much worse. Both individual and archetype split models were missing robots that were detected in the base line.
The reason seems to be a data imbalance. In the dataset I used, House Bot has 24,992 instances. Many opponents have 200 to 600 (Cavaco 264, Elytra 164, Iron Warrior 174, Flight Controller 2 111).
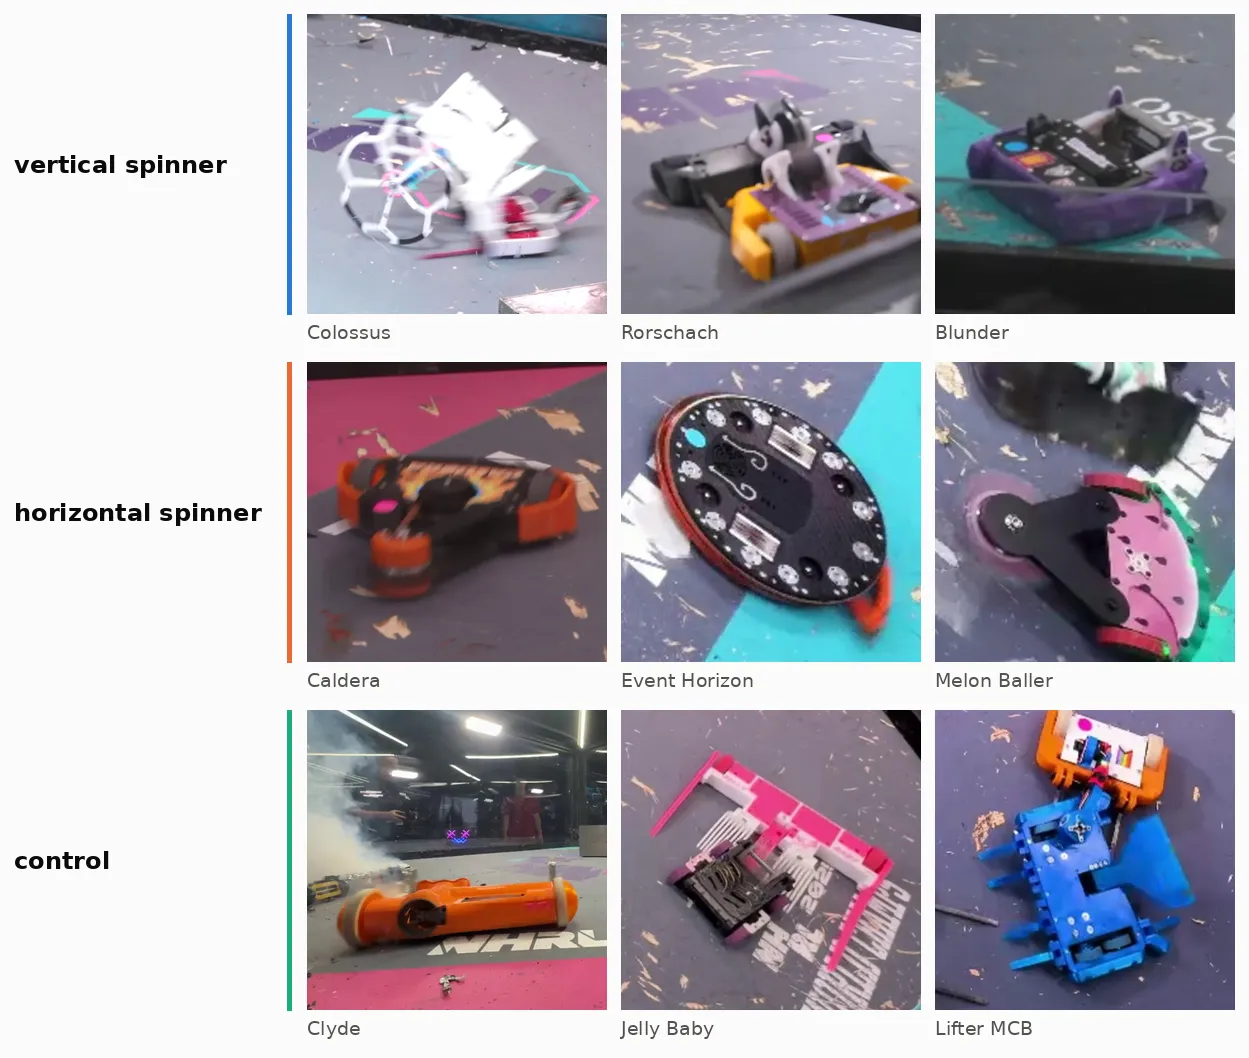
Same with archetype. Hammer saw robots see far less instances than vertical spinners. NHRL robots also look wildly different. There are many “vertical spinner” robots that don’t look alike at all. The model has to rely on context to identify the robot and less on the robot’s appearance.
Relevant reports (warning: all the linked reports are AI generated, so they may not make sense):
Bounding box or segmentation
Before continuing, I wanted to know if I should use YOLO segmentation or bounding boxes for opponent robots. Ideally I would use keypoints for both our and opponent robots but I don’t have a way to mass annotate images with keypoints like I can with segmentation maskss.
Here’s the model scored on metrics against the ground truth dataset:
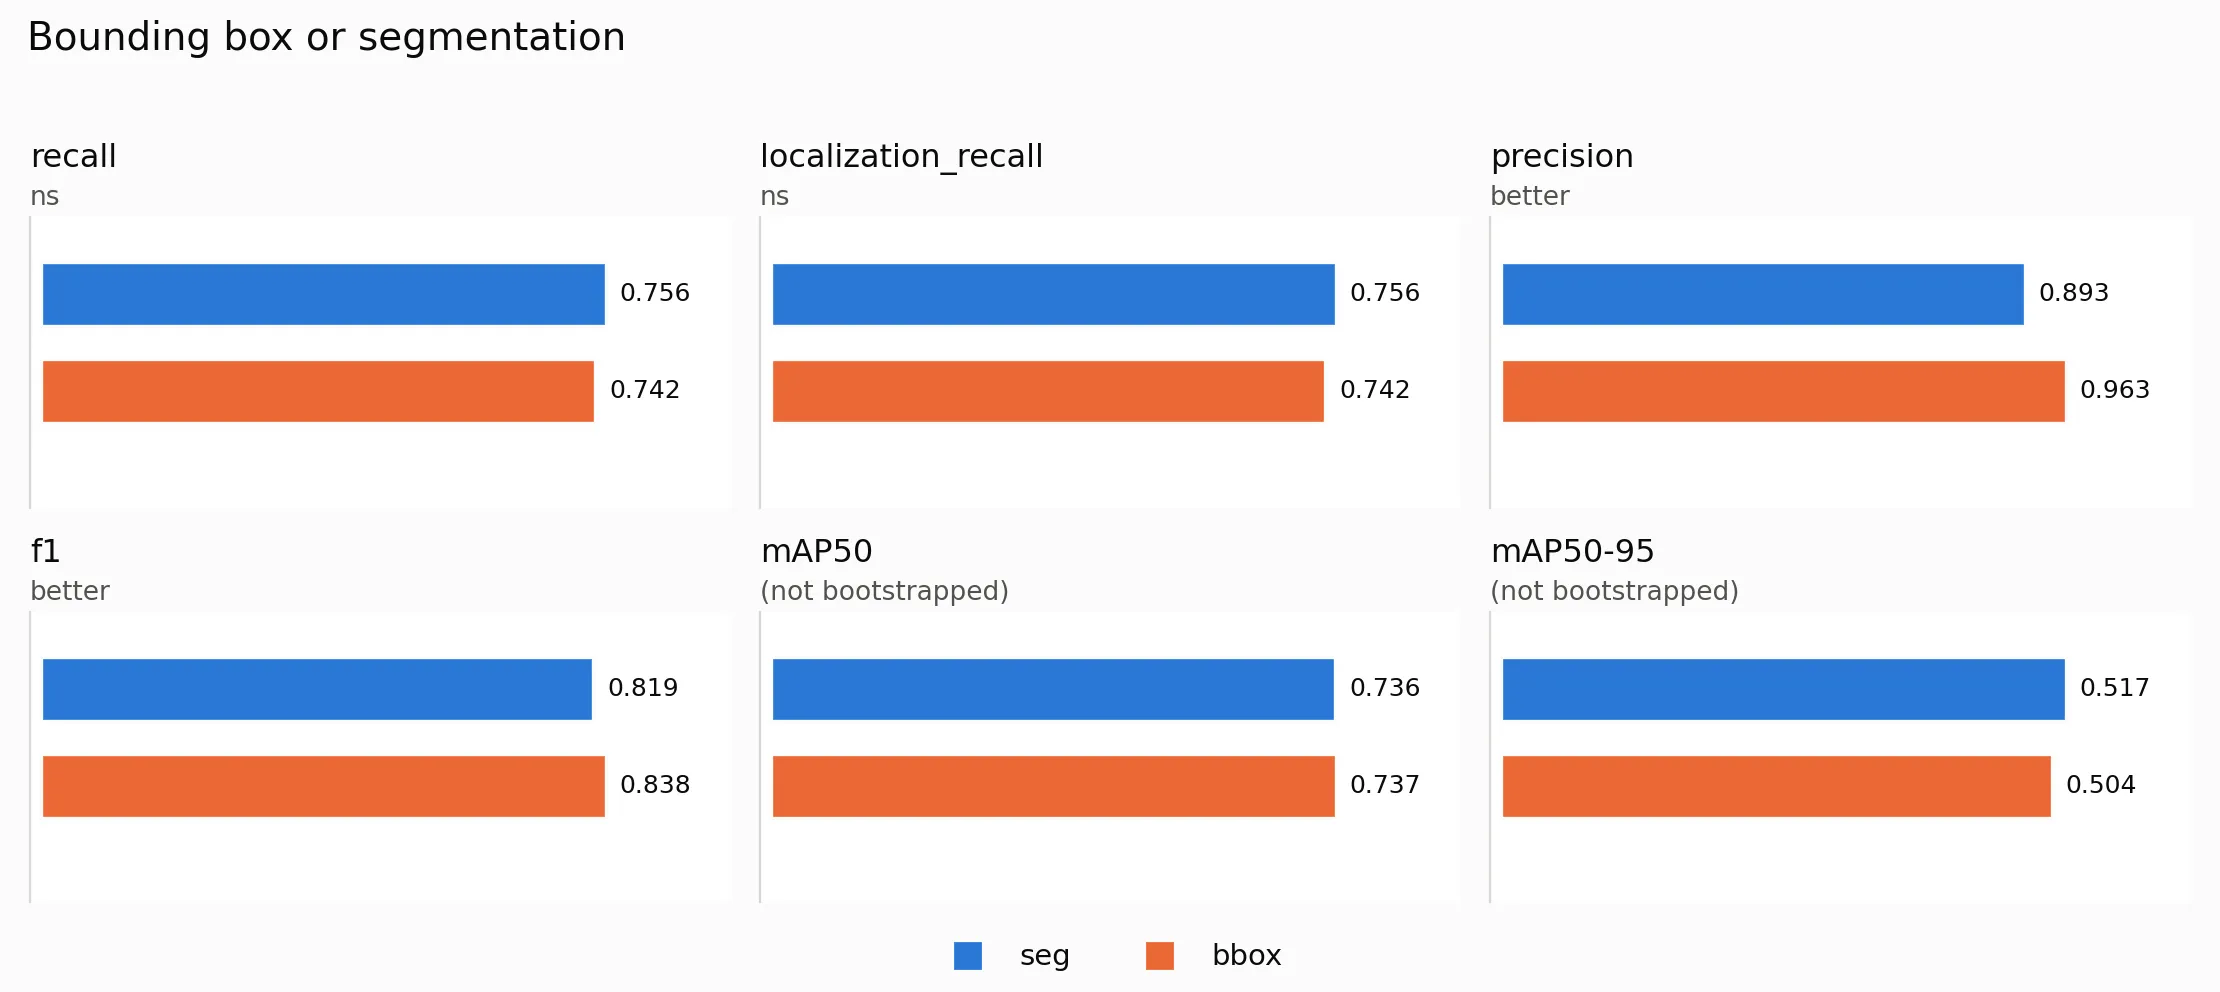
Here’s their latencies running on my desktop:
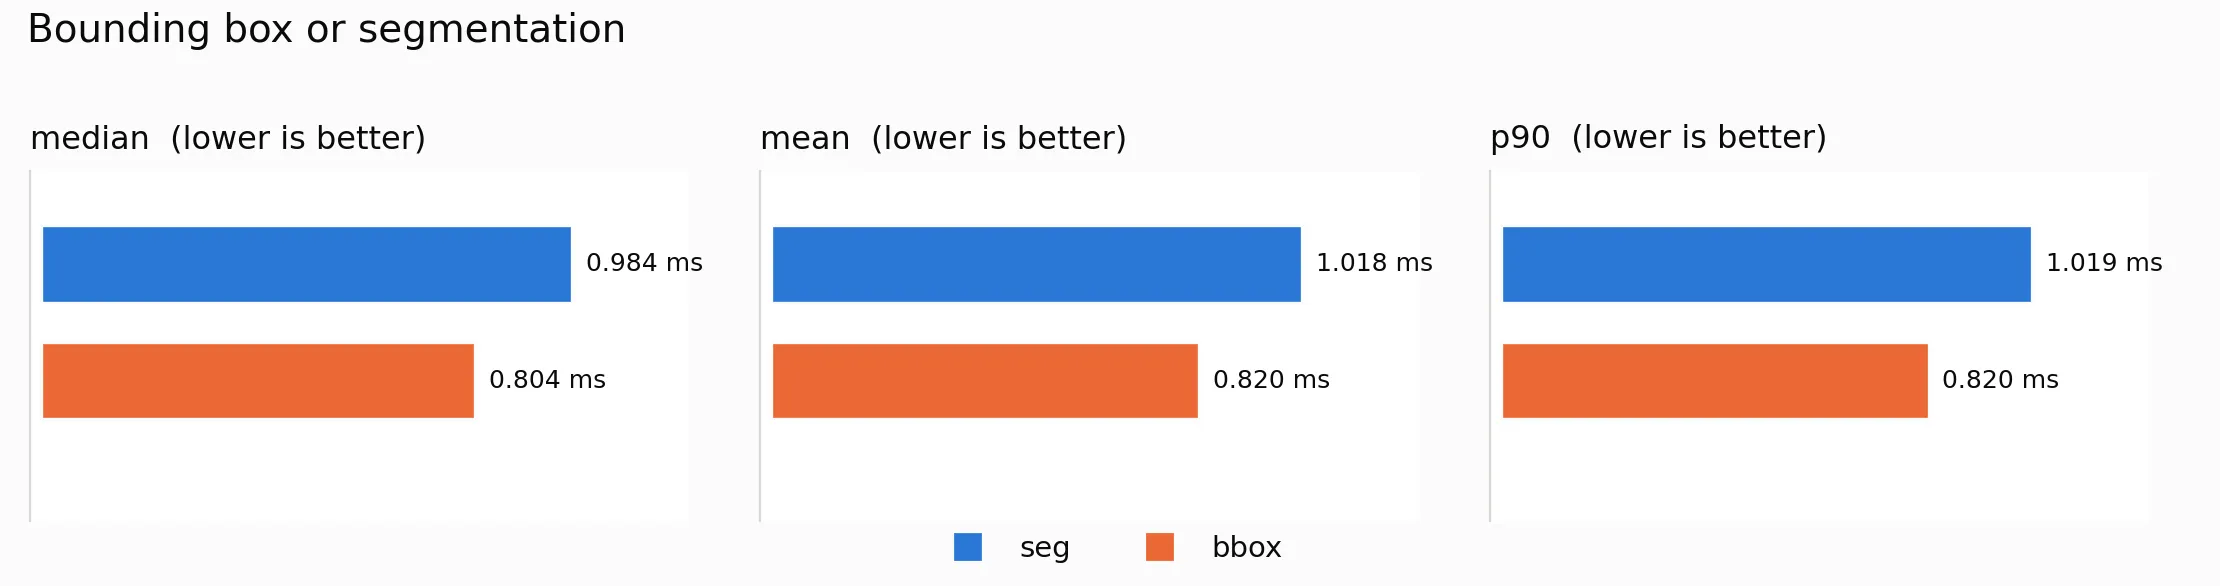
The recall performance is nearly identical and latency is better for bounding box (~18% faster). It also cuts down on training time. I decided to train using bounding boxes from now on.
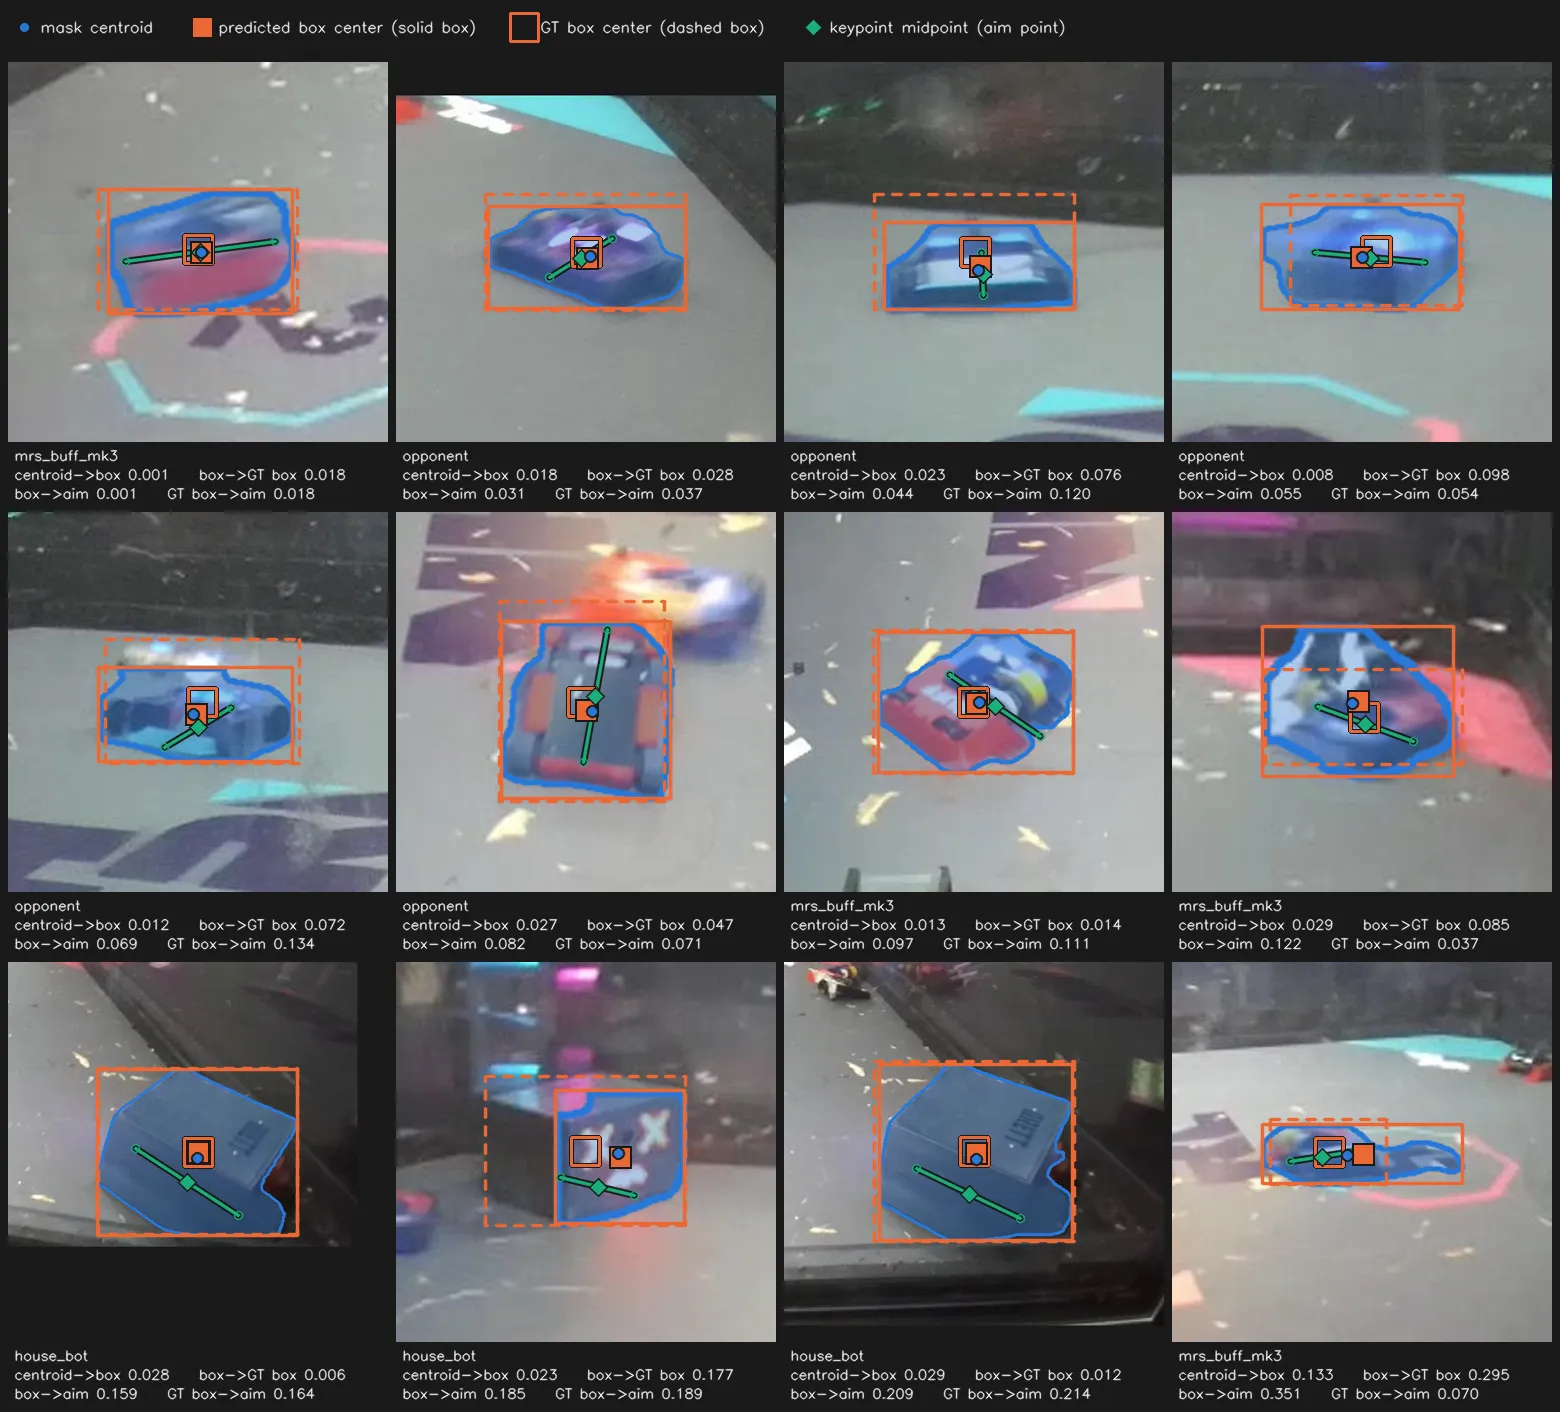
Bounding boxes contain less information than segmentation but I wanted to know how it would affect accuracy. Here’s some samples comparing keypoint, model output mask, model output bounding box, and ground truth box. The top row is some cases where they all align nicely. Bottom row is some of the worst cases.
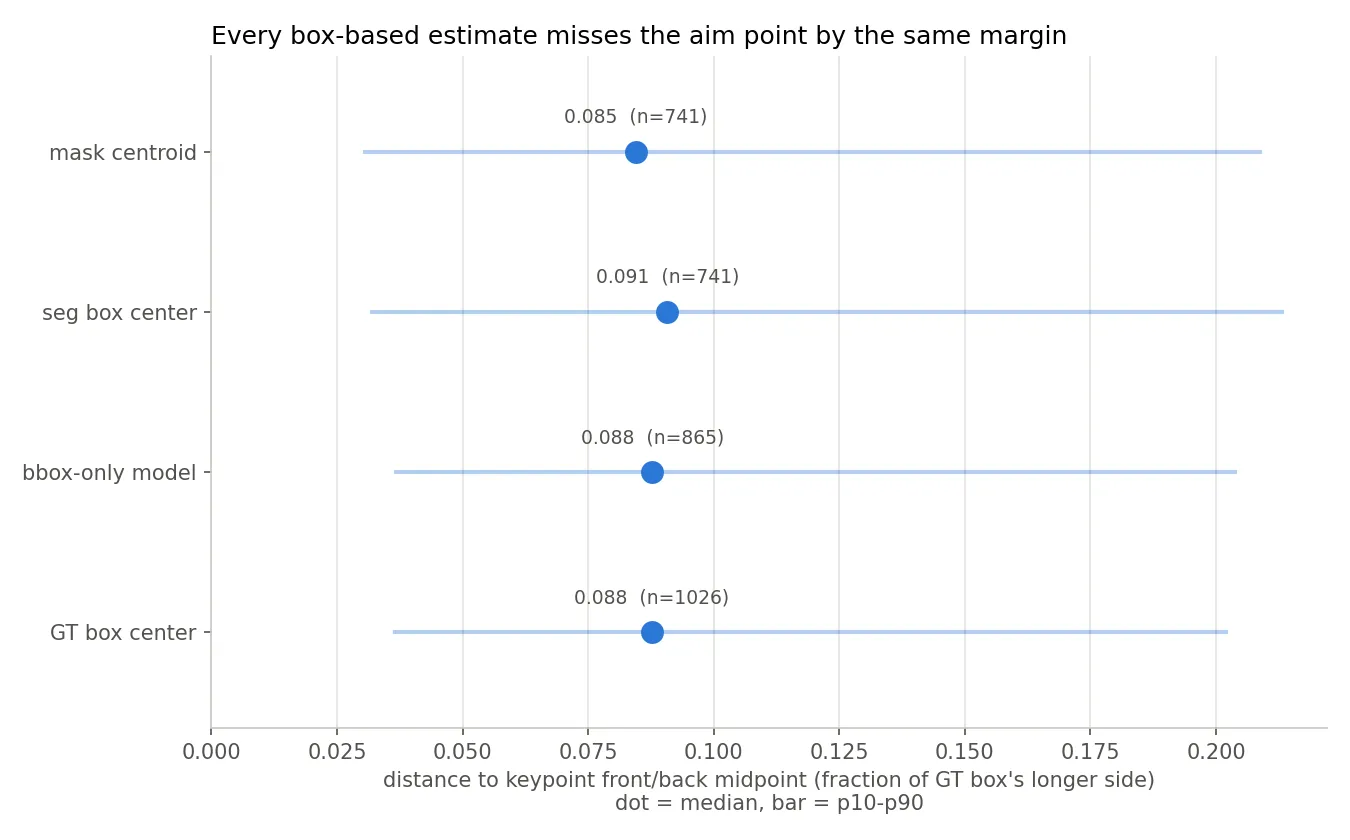
Here’s some graphs that illustrate the point across the test dataset. The majority of mask centroids sit within 2.5% of the box’s longer side. Bounding boxes tell a similar story.
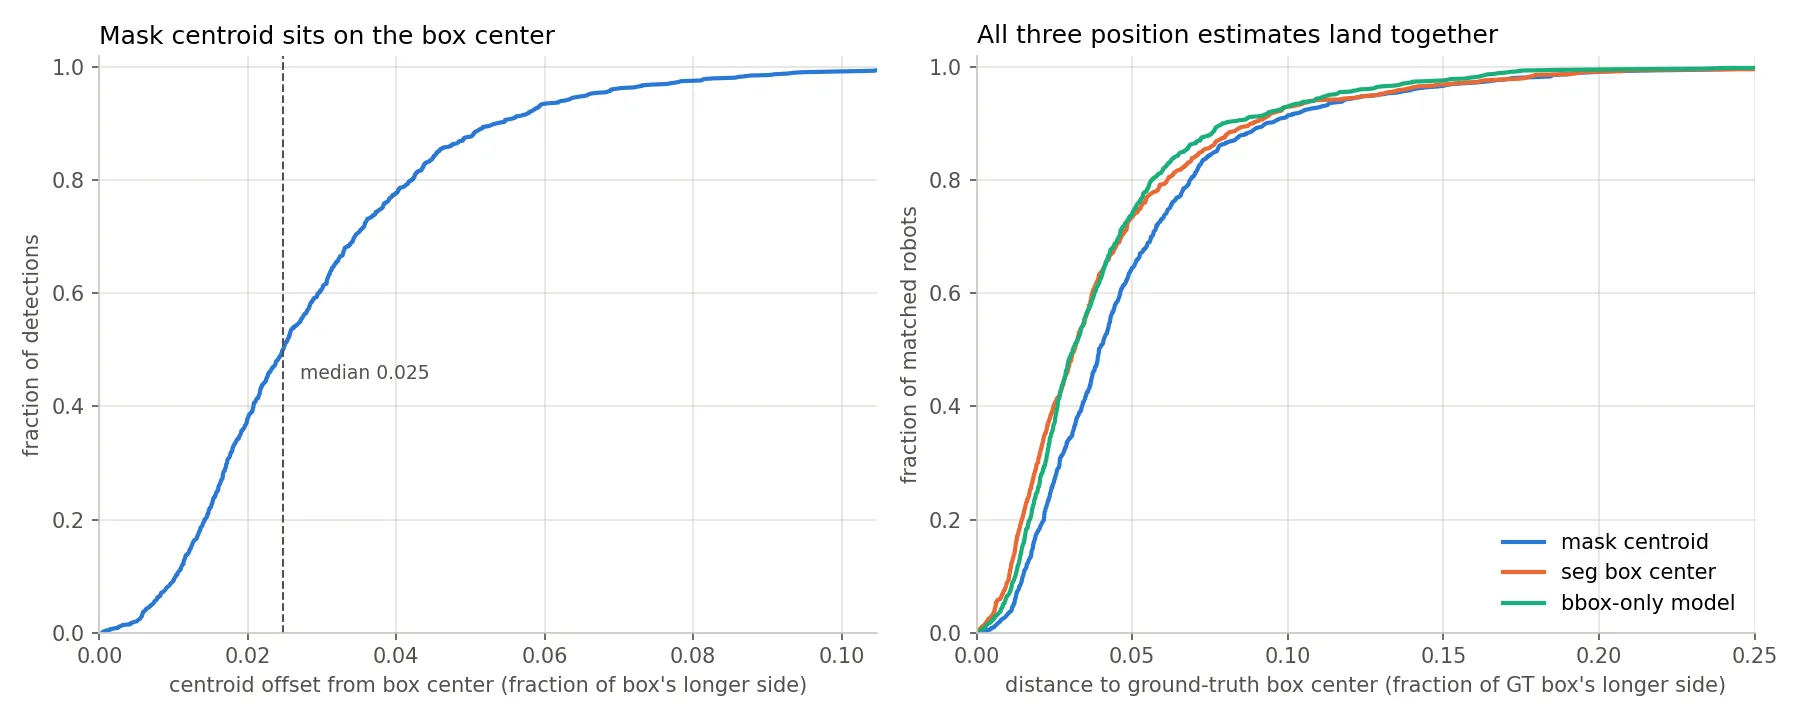
I’ve labeled keypoint data in the ground truth data. Since that’s ultimate what I care about, I did a comparison against this data. All data sources produce nearly identical measurements. So while none of them are perfect, switching to bounding boxes will not degrade performance.
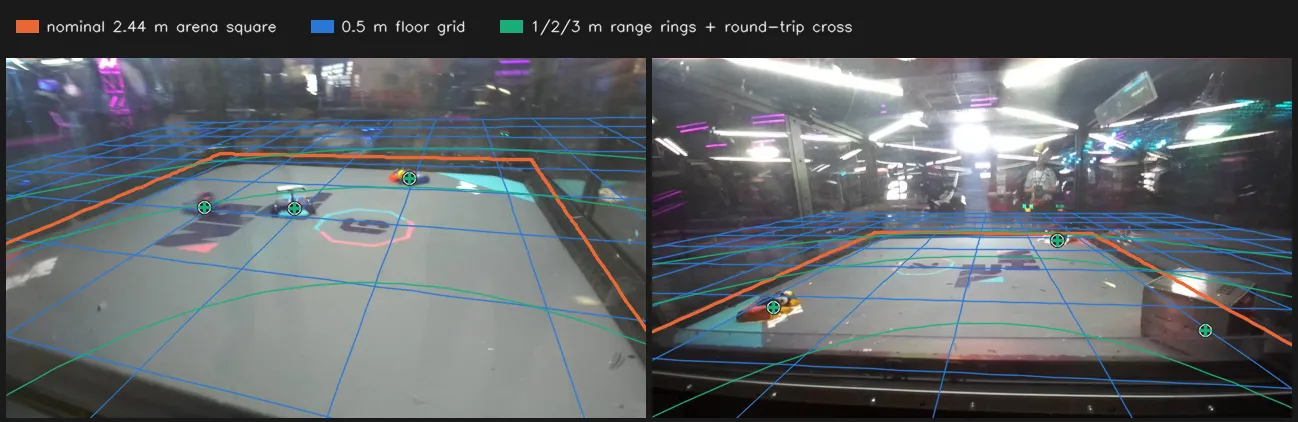
I’m projecting the pixel values onto a 3D plane, so these errors mean different things depending on distance from the camera. This diagram shows what 1, 2, and 3 meters of range from the camera looks like when projected onto the field:
I made a script that projects the computed mask centroid, segmentation mask box center, bounding box center, ground truth box center, and keypoint mid point onto the field plane. With the projected values on the 2D plane, I compute the error in millimeters.
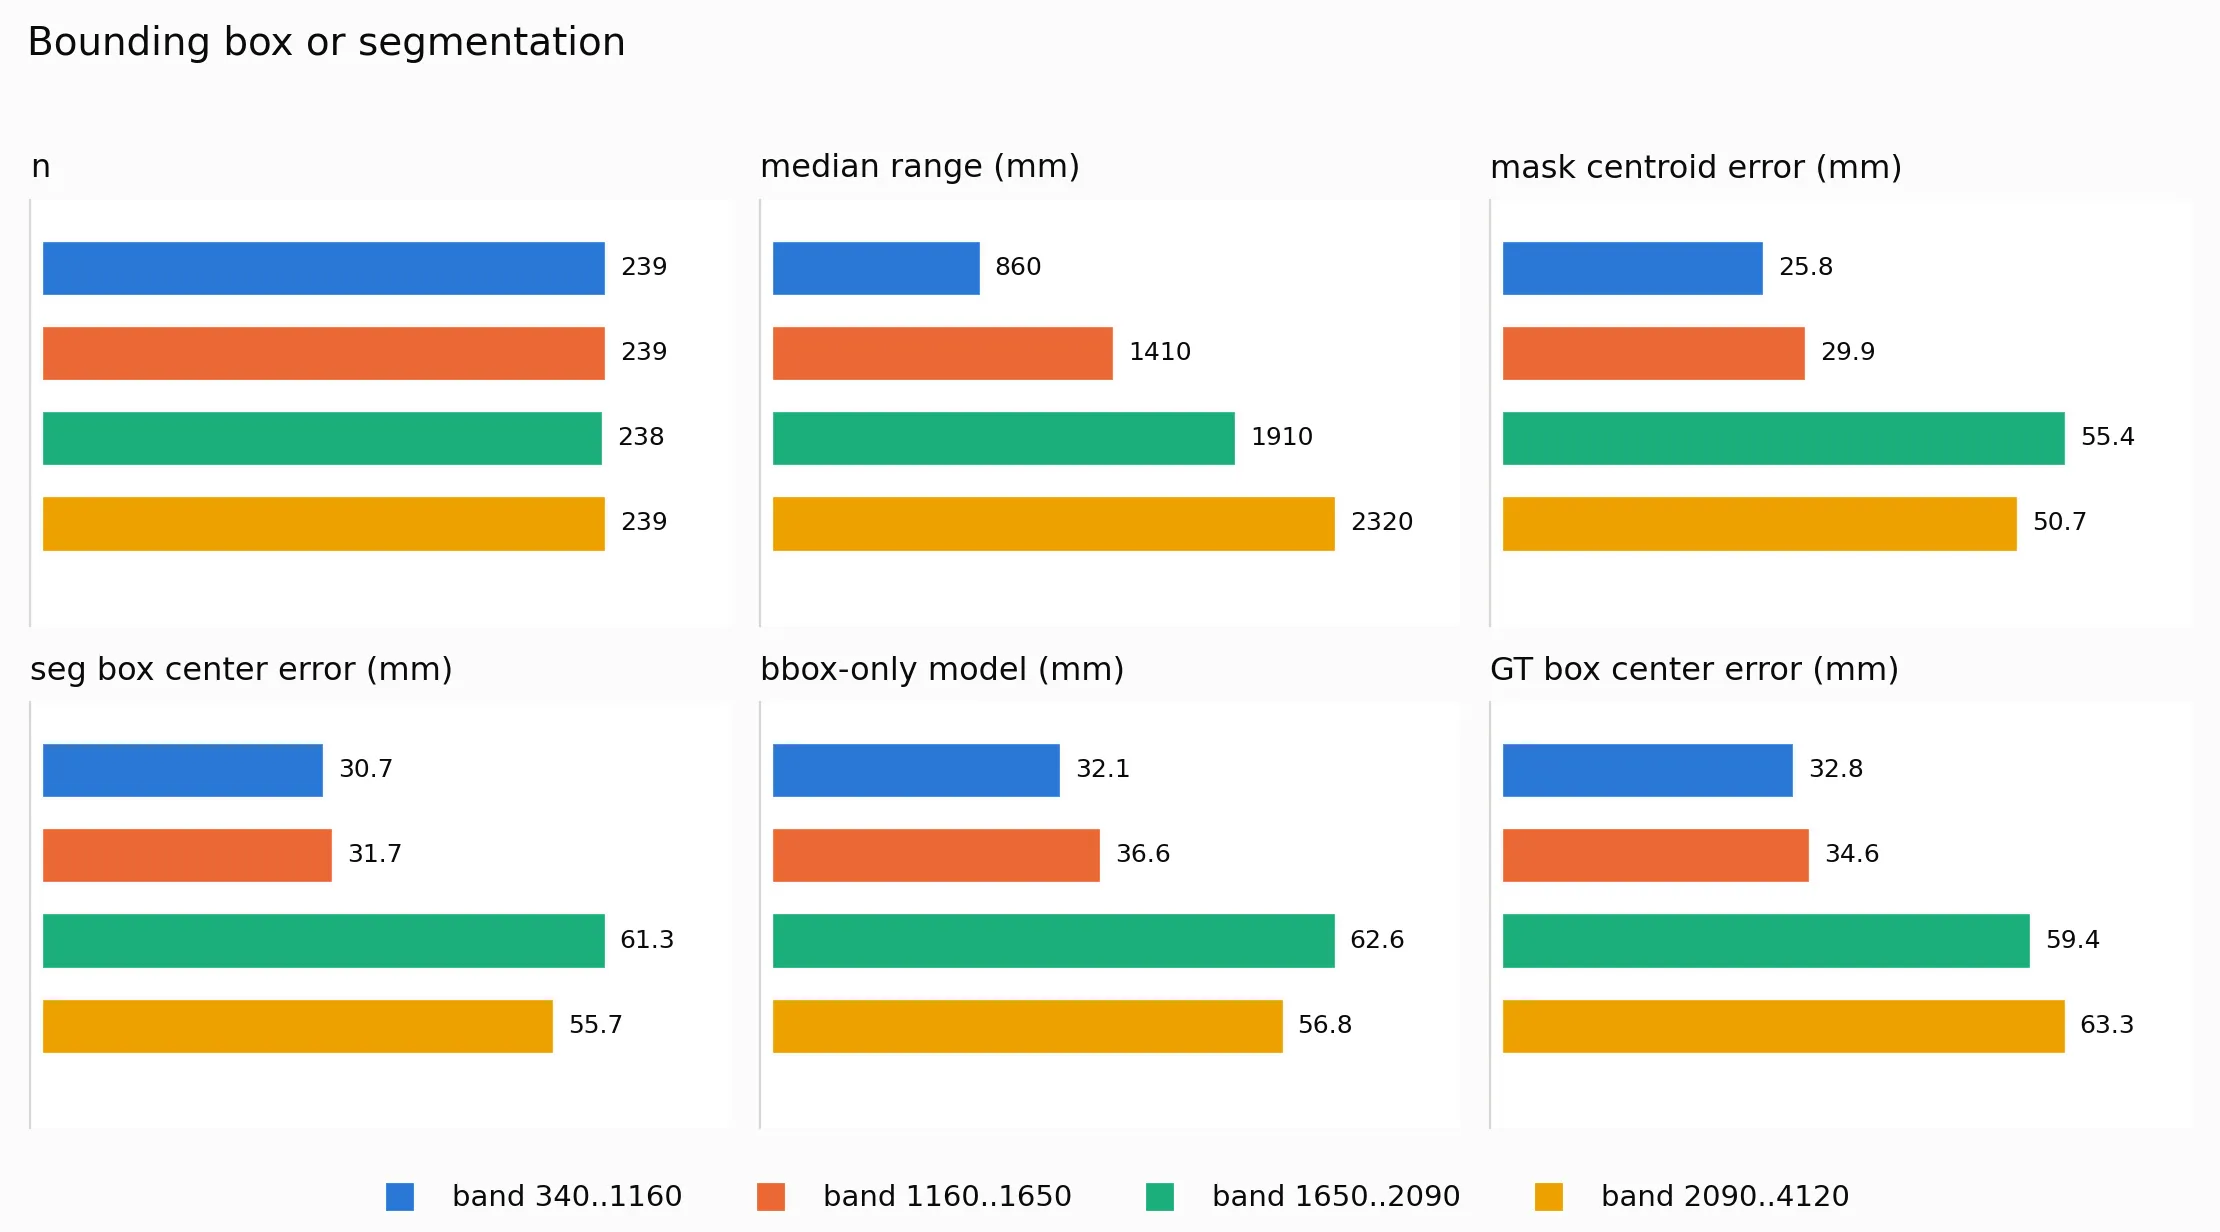
Luckily the effects of distance and bounding box largely cancel out. As the bounding box size shrinks, the keypoints and centroid get closer so the pixel error decreases. But as the bounding box shrinks, the robot is likely receding away from the camera so small pixel values increase projection error.
Based on these results, I concluded, using bounding boxes was no worse than segmentation. Until I can get lots of keypoint data for opponents, I will continue to use bounding boxes.
Single model?
Can the “our robot keypoints” and “opponent bounding box” models be combined? It would be much better for latency if I only had to run one model instead of two. For May, I ran both models in sequence to keep things simple, but that cost me double in latency.
I approached this from two angles:
- Can synthetic data be used to learn the keypoints of all NHRL robots?
- Can existing bounding box data be used and just mask out the keypoint data for opponent robots?
Synthetic
I used Meshy 6 to generate 146 3D models of NHRL robots from single images from Brettzone (https://brettzone.nhrl.io/). I generated 20,000 images from these models. The baseline keypoints model was trained on 34,946 images. A few hundred hand labeled images are thrown into the mix.
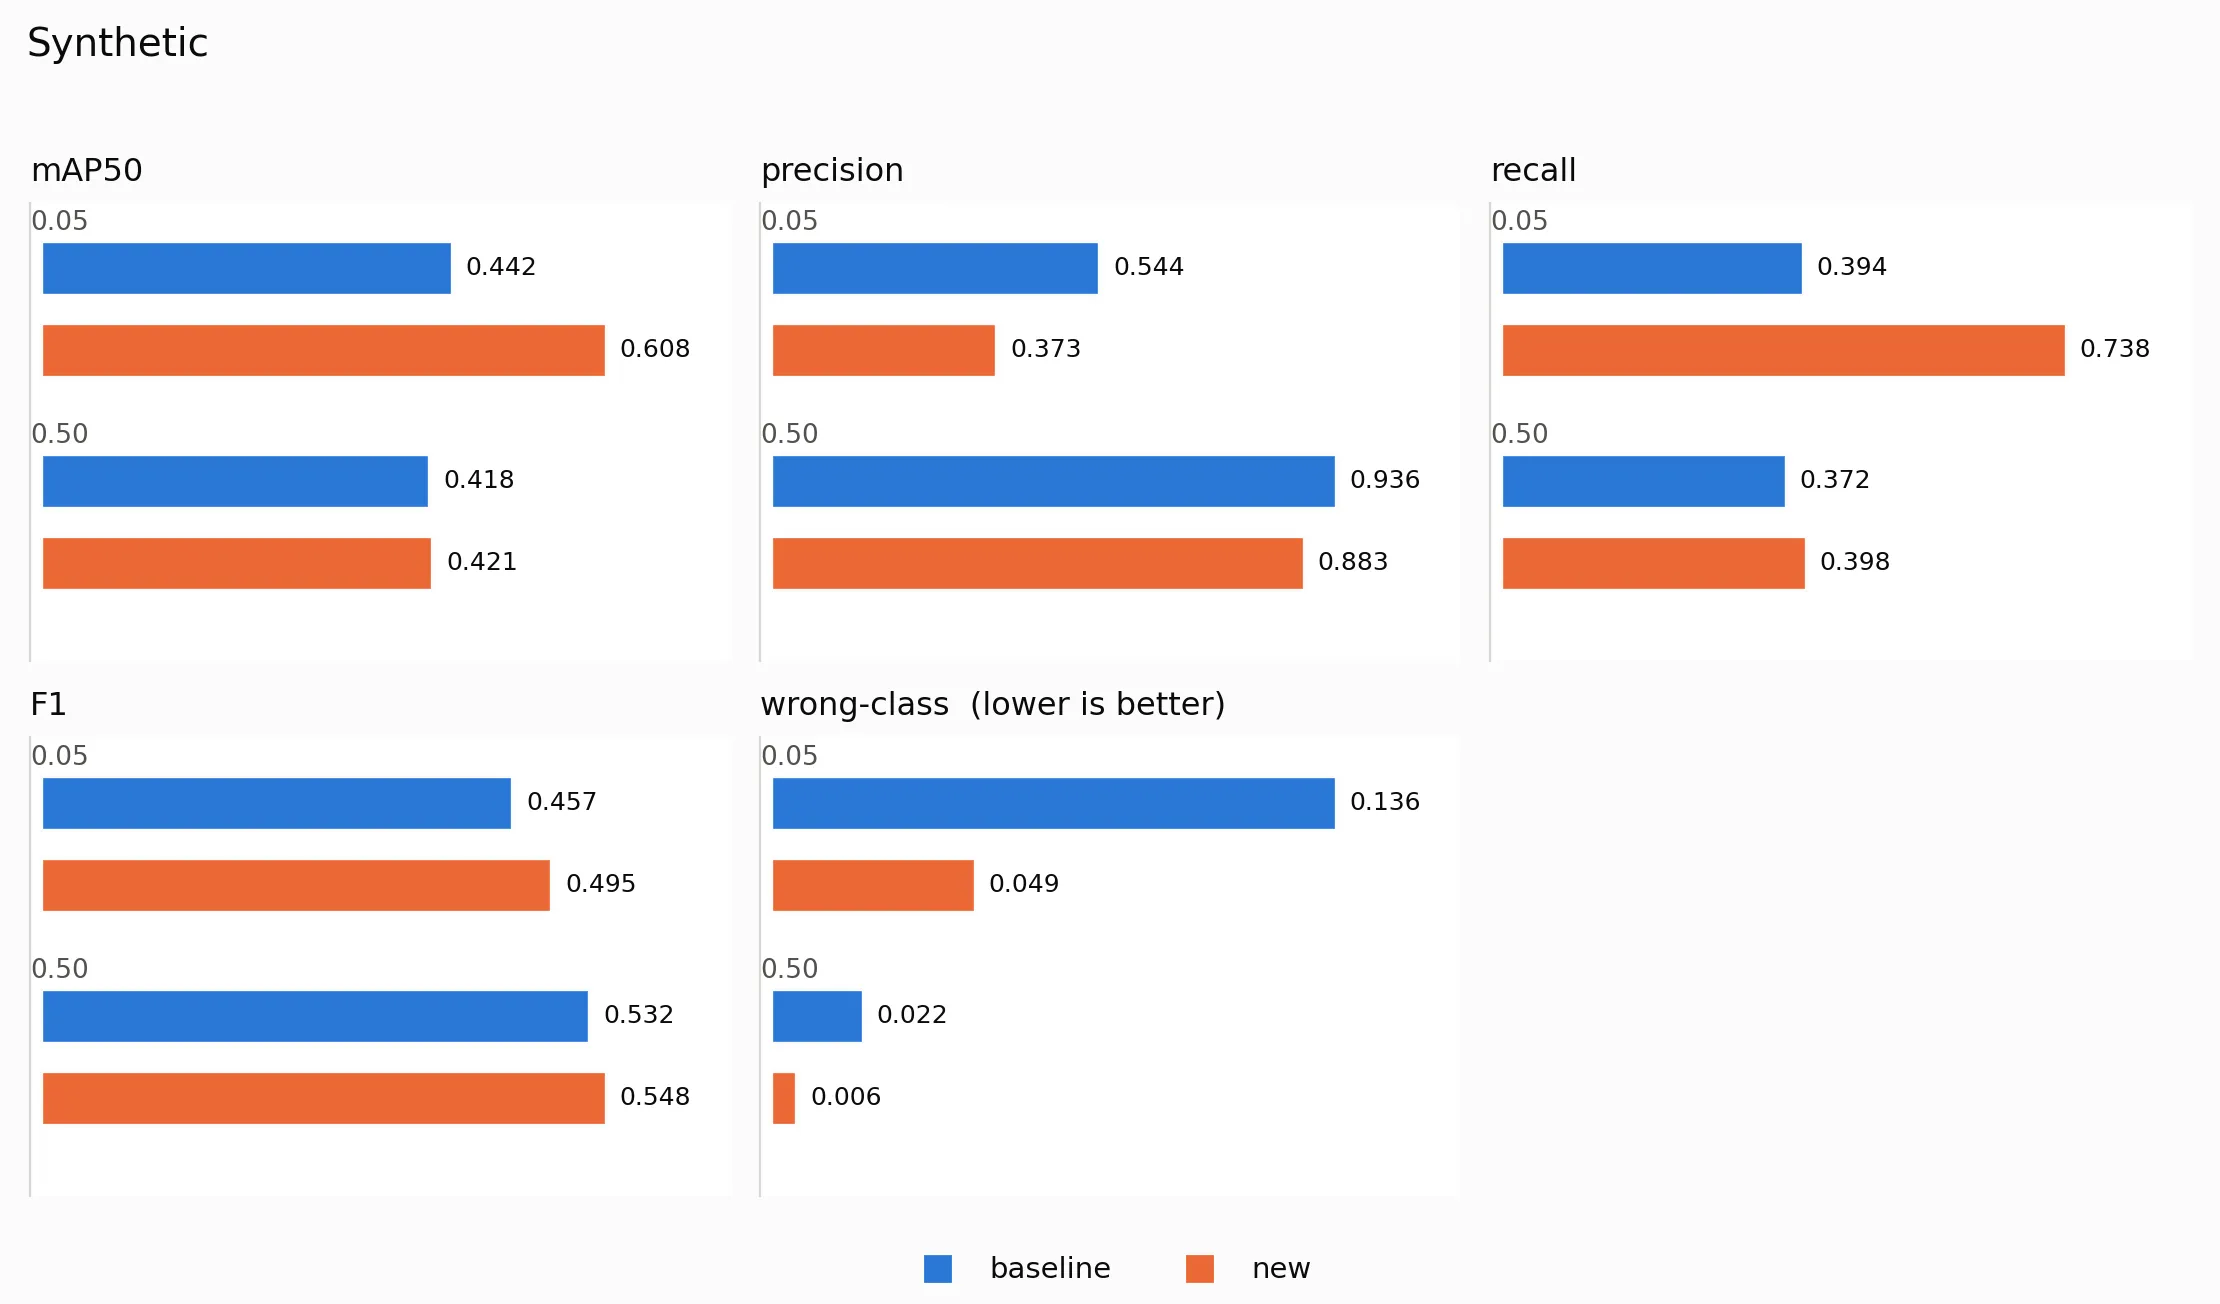
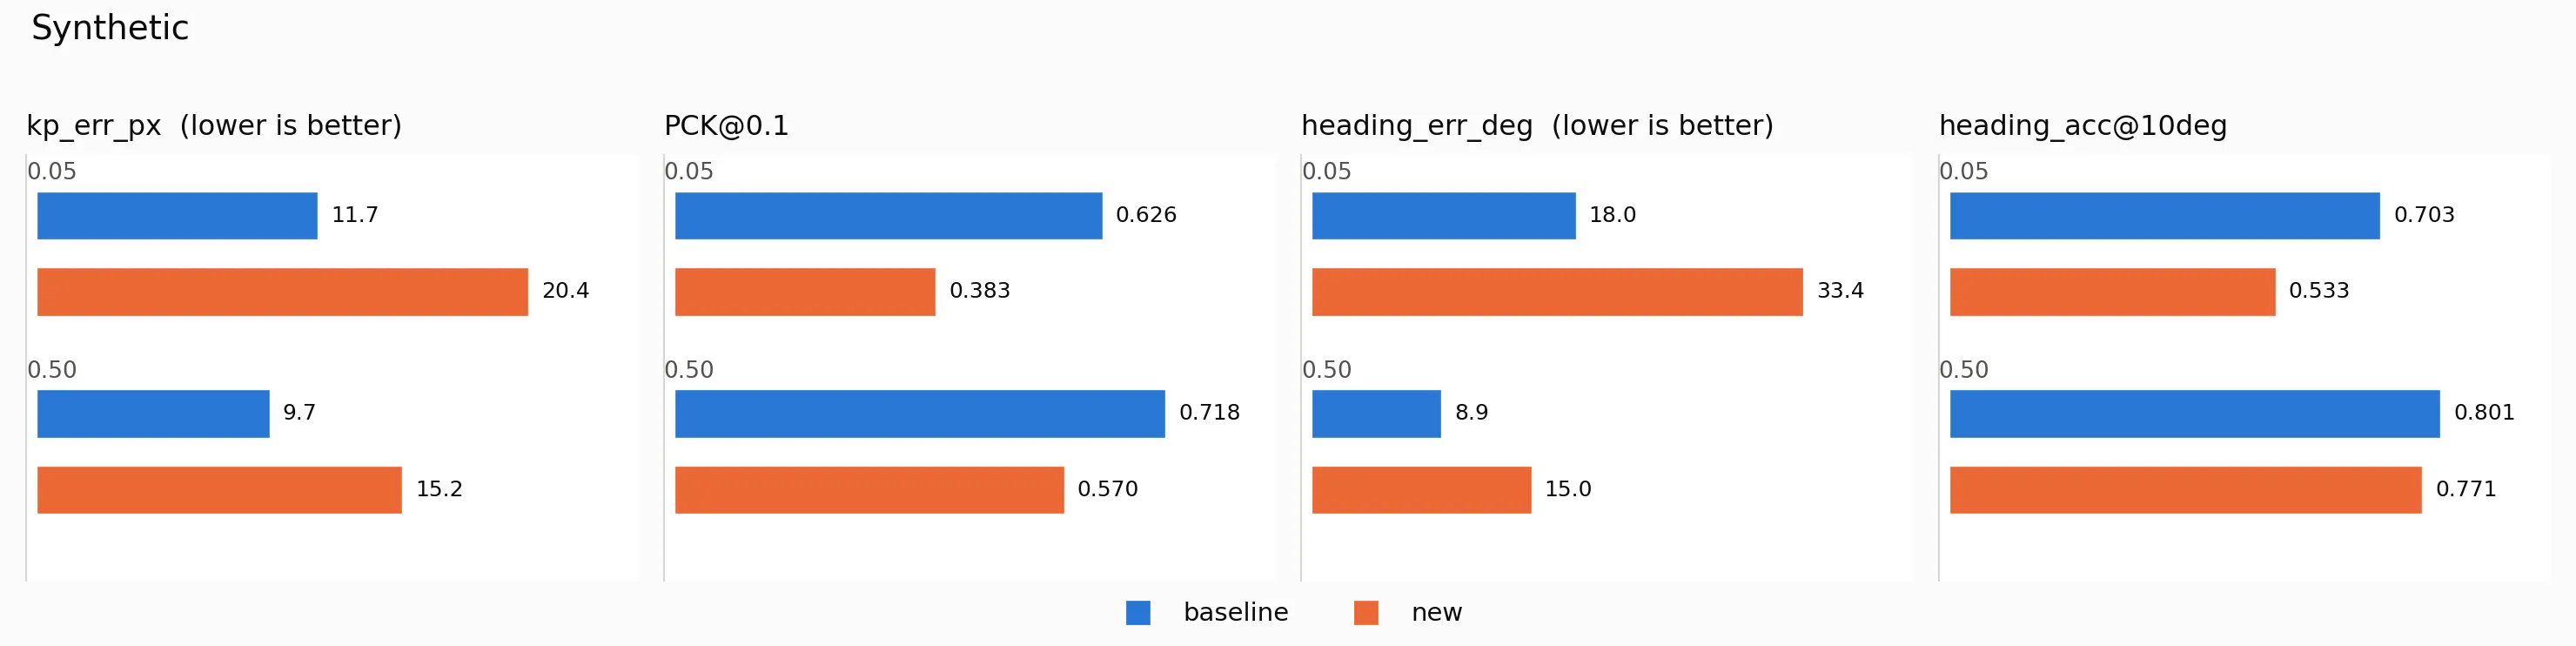
Recall was similar but keypoint accuracy for Mrs Buff MK3 was much worse.
Ignore opponent keypoints
The YOLO keypoints model outputs always outputs bounding boxes along with the keypoints. The model can mark a keypoint as visible or not. In this experiment, I marked all opponent keypoints as “hidden” and kept all Mrs Buff MK3 keypoints visible.
| model | Description |
|---|---|
| blob_generic (real seg, 5 class) | Baseline model opponent robots mapped to a single “robot” class |
| blob_indiv (real seg, per-class) | Baseline model all robots individually named |
| all_robots (pose, generic-syn) | Keypoints trained on synthetic and a little bit of real data. Opponents trained on synthetic models |
| deploy (pose, real+syn) | Keypoints trained on synthetic and a little bit of real data. Opponents trained on real images with keypoints marked as not visible. |
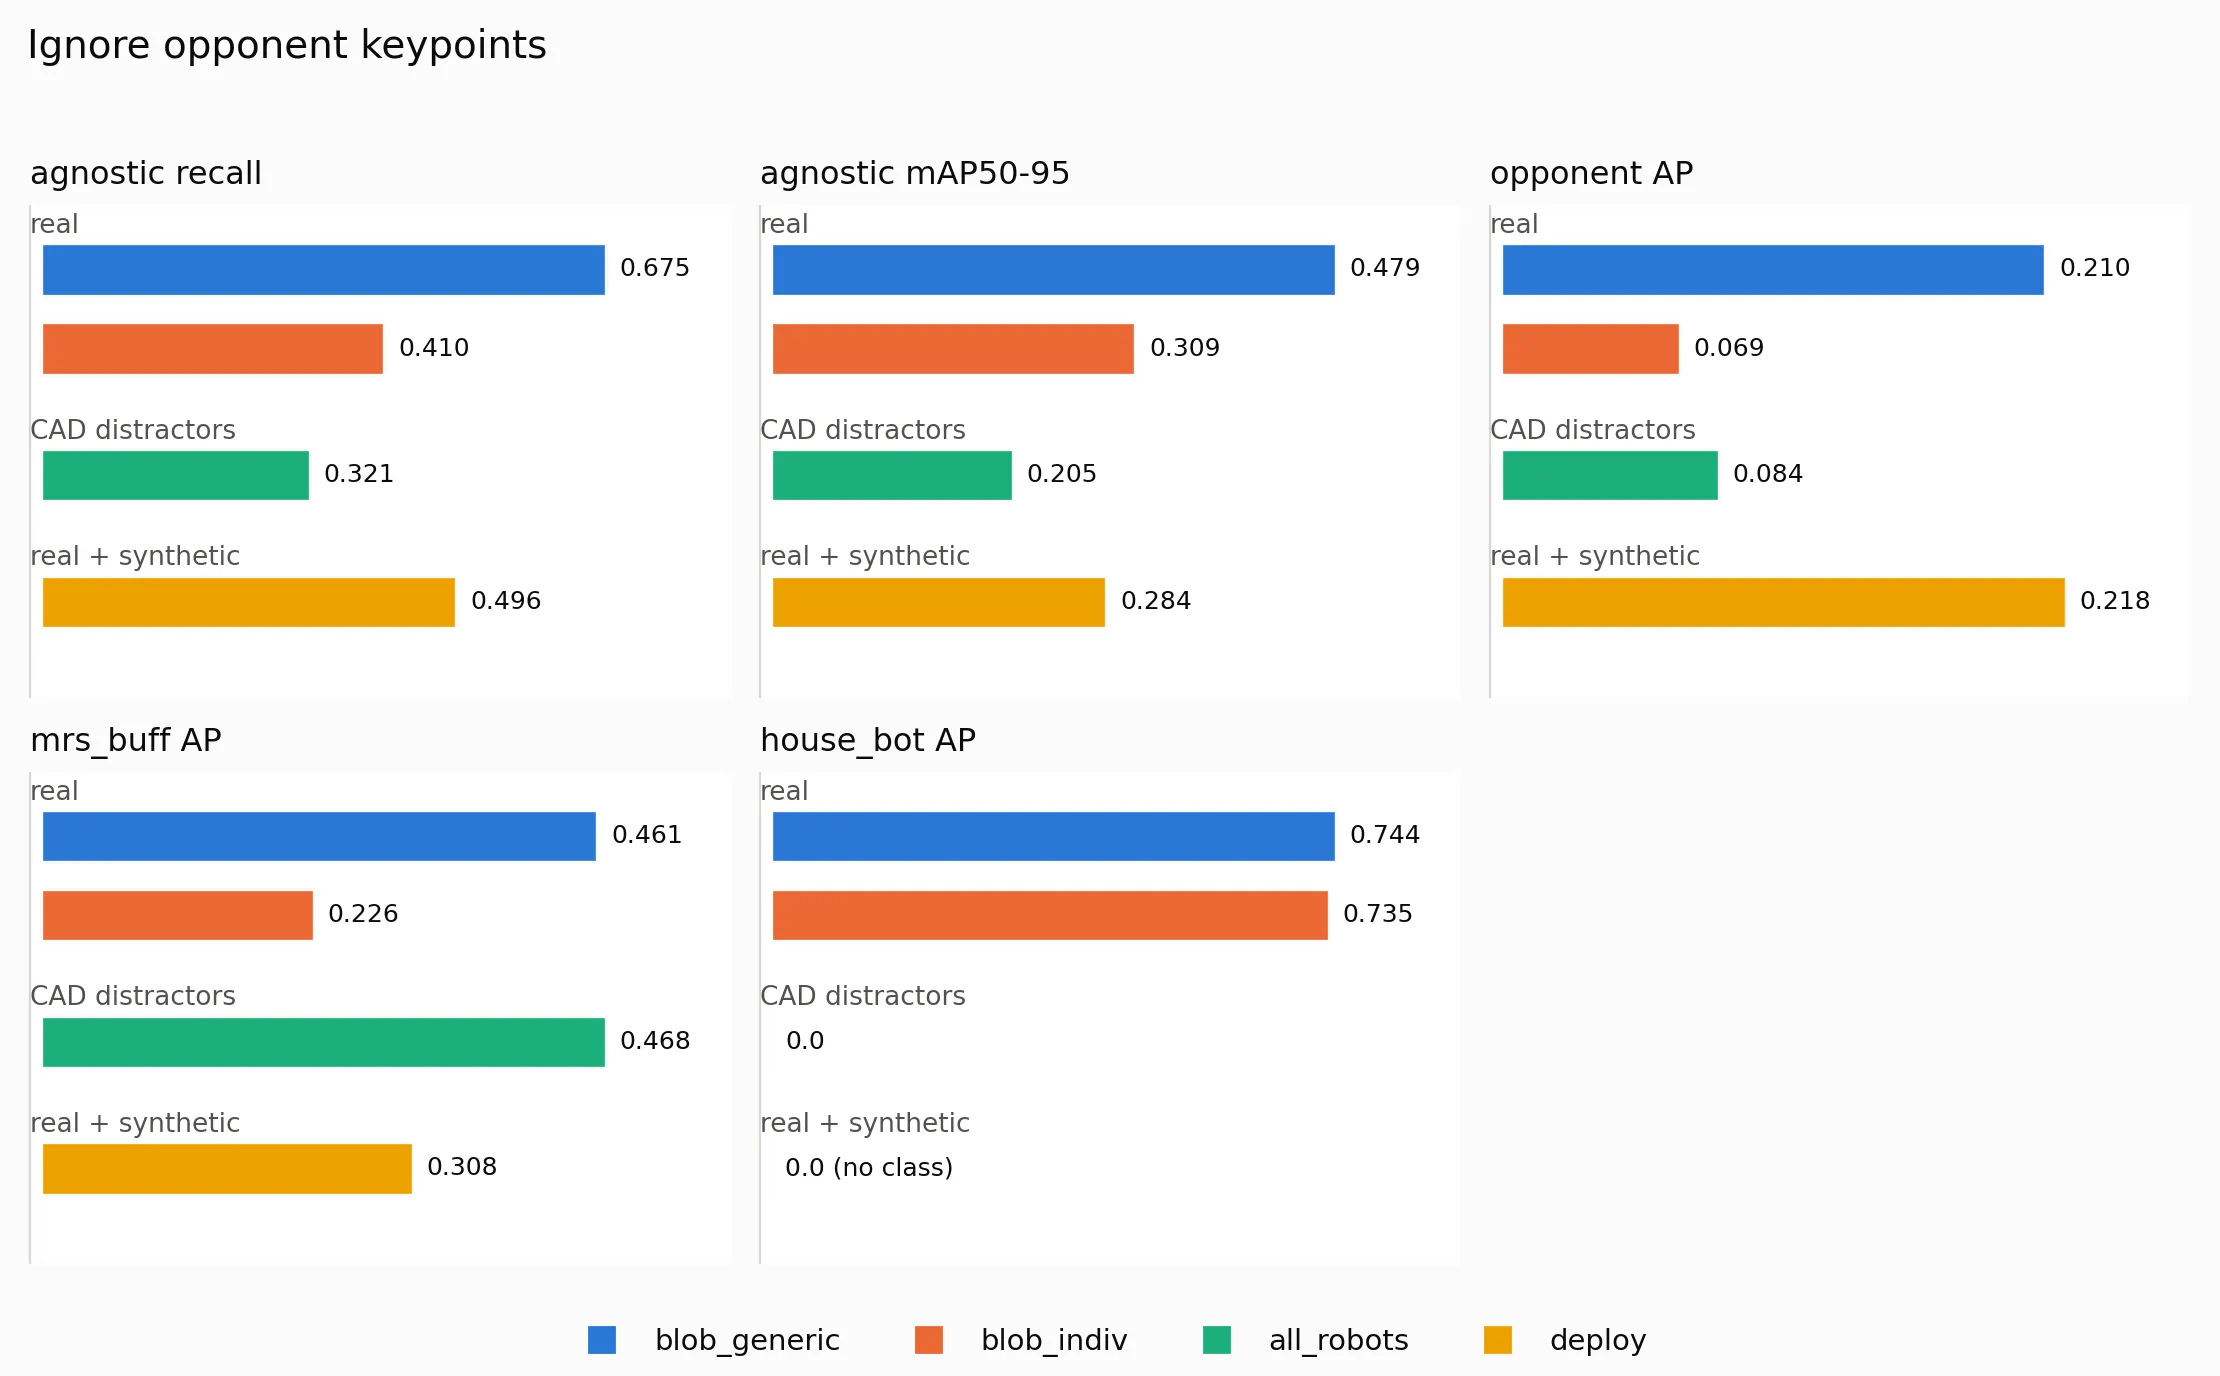
Recall is worse here but AP improves.
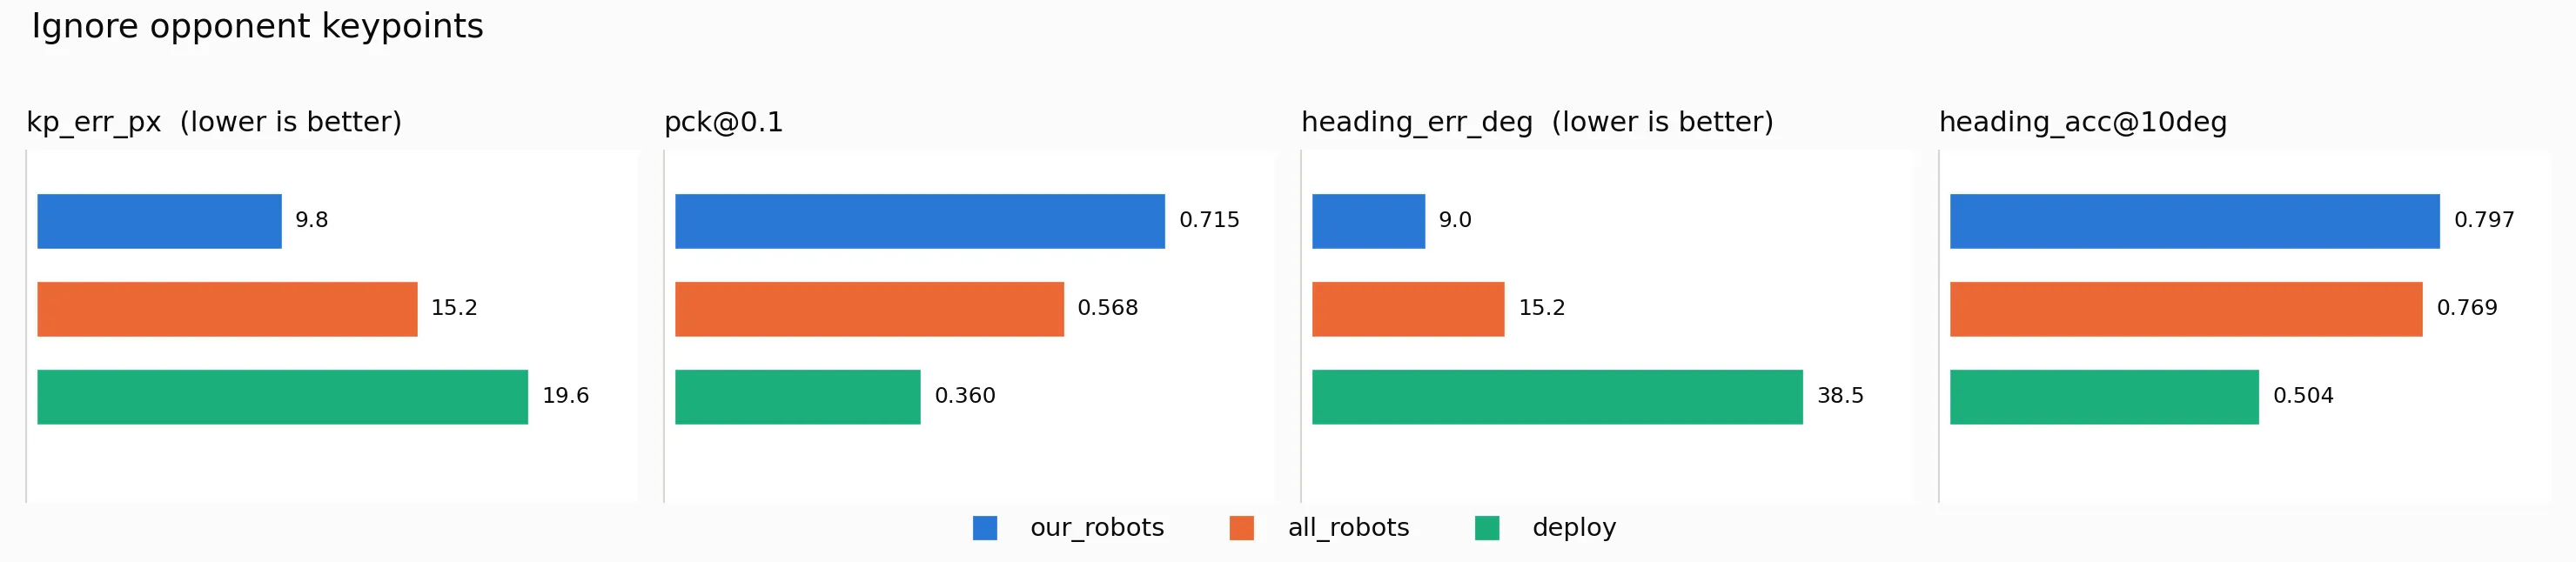
However, keypoint accuracy on Mrs Buff MK3 degrades in this model too. In this dataset there are 74k opponent boxes and 47k keypointed boxes. So it’s possible the model is biasing towards learning opponents instead of placing keypoints accurately.
My theory is these two models learn very differently. I don’t have a scene in blender that looks like the NHRL cage so I render on randomized backgrounds. Mrs Buff MK3 has CAD that matches what the robot looks like. The keypoints model learns exactly what Mrs Buff MK3 looks like no matter what the background looks like.
This begs the question: What is the model learning?
Relevant reports:
What is the model learning?
To probe what the model is actually learning, I ran two more experiments. I realized of the 140+ models I generated, only one robot was in the test dataset. I wanted to prove that if the generated robot is in the dataset, the model can learn what it looks like. So I generated new models from Meshy with these 4 robots and generated a synthetic keypoints dataset with just these 4 robots + Mrs Buff MK3.
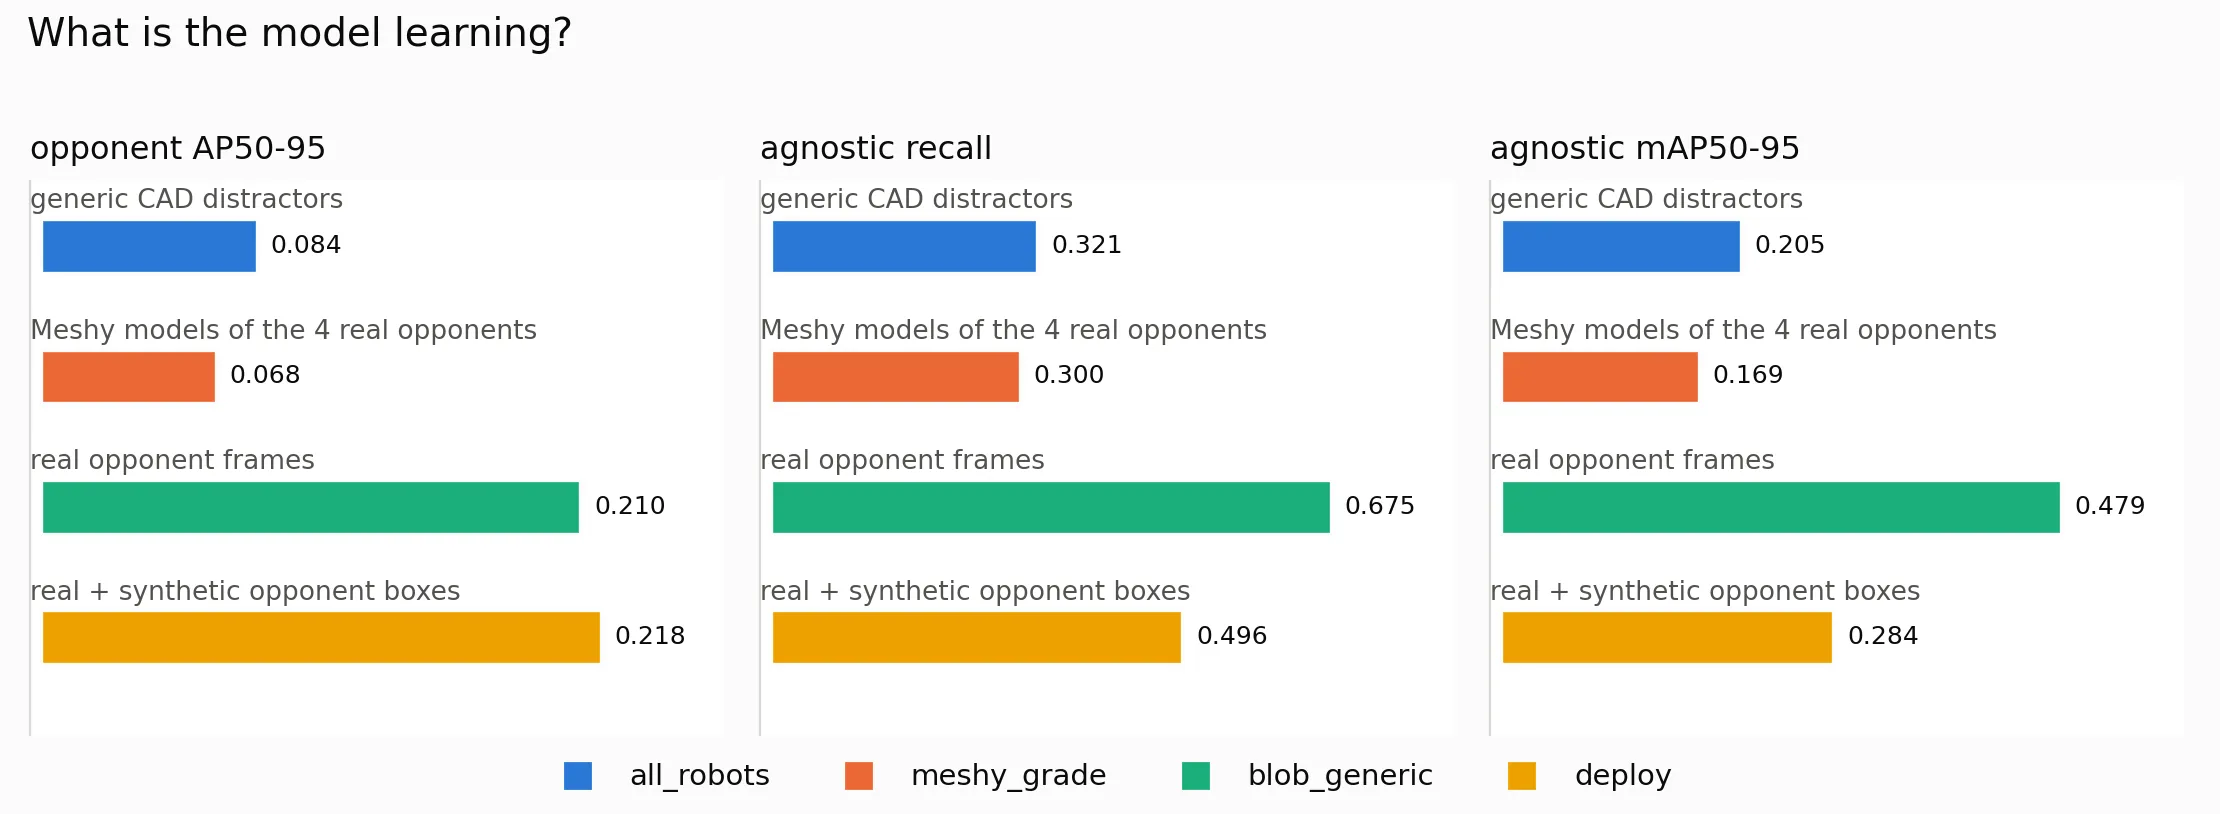
Recall is still poor in this model.
Here’s a per-opponent score.
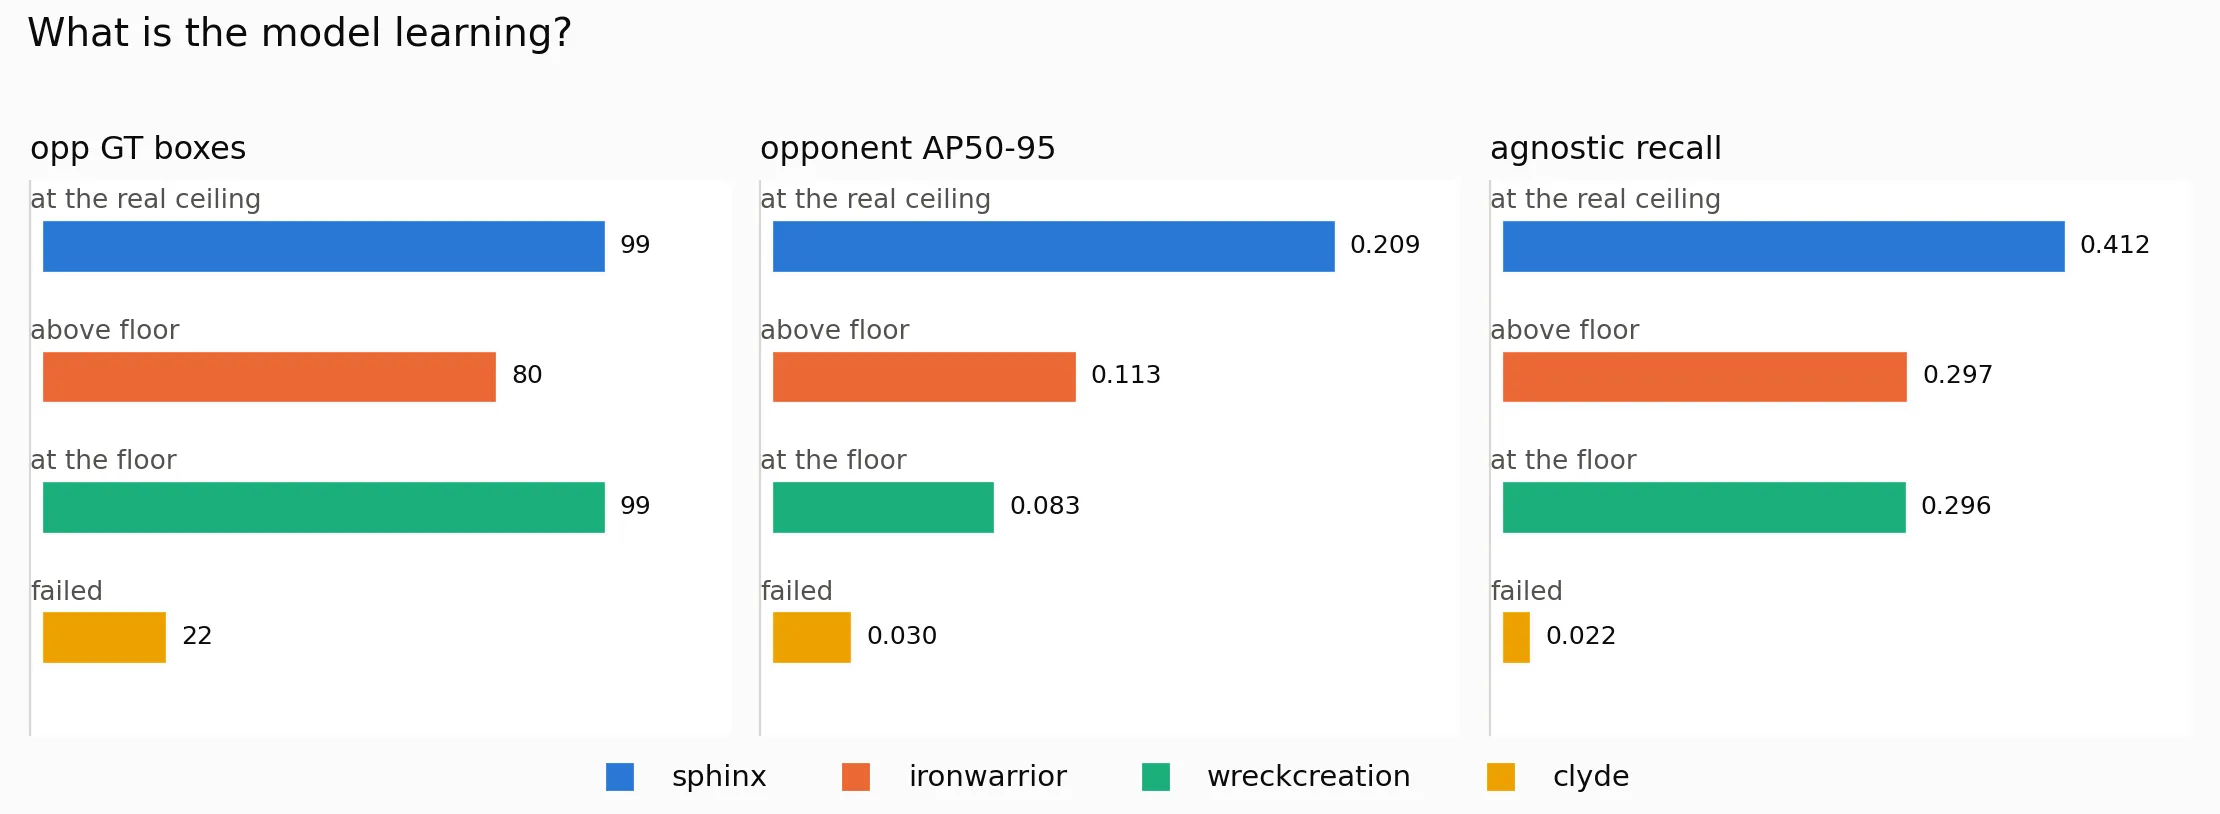
Sphinx performed better. To get an idea of why, let’s look at some samples from the synthetic dataset:
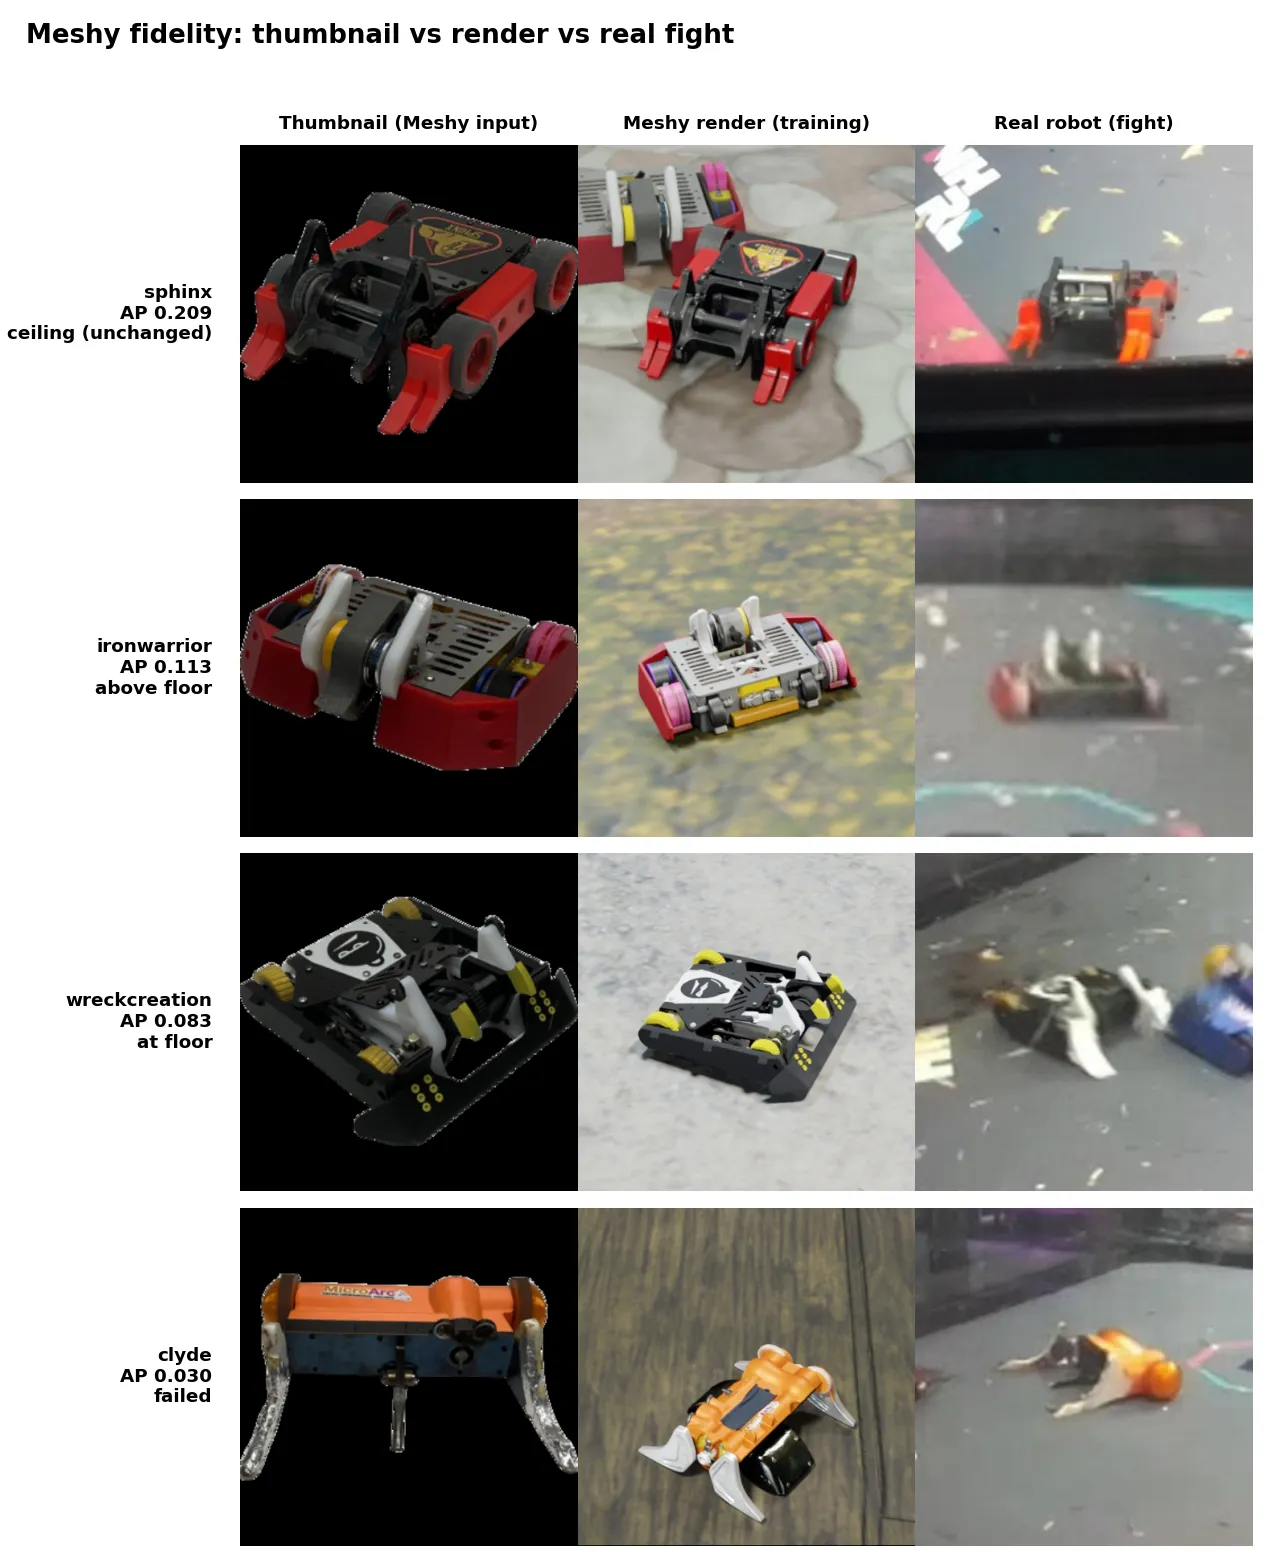
Sphinx came out on top because it looks basically the same as the generated model. For Wreck Creation, this team modified their robot so the real robot doesn’t look like the model anymore. Wreck Creation added a white wedge plate that’s not present in the image.
Iron Warrior and Clyde’s generated models are just poor quality and doesn’t look like the real robot. The generated model for Iron Warrior has the back panel missing. I’m not sure what happened with Clyde’s model. I think it’s just a weird looking object so Meshy couldn’t figure it out.
So that confirms to me that YOLO can learn the appearance of a robot from generated models, not just CAD. However, teams will modify their robots minutes before the fight or not update their picture. So it’s impossible to learn opponent appearance with this method.
Is YOLO learning the background?
That begs the question then, is YOLO learning what the cage looks like and therefore anything inside the cage is a robot? Since I don’t have a large dataset of real labeled keypoint images, I trained a model on bounding boxes comparing the effects of synthetic vs real images.
Here’s the dataset composition used for this test:
| dataset | train | synthetic | real | val (real, scene-disjoint) | synthetic in val |
|---|---|---|---|---|---|
nhrl_robots_bbox_2class (real_only) | 25,914 | 0 | 25,914 | 6,573 | 0 |
synth_only_2class | 17,995 | 17,995 | 0 | 6,573 | 0 |
mixed_2class | 43,909 | 17,995 | 25,914 | 6,573 | 0 |
Here’s the score results after 100 epochs:
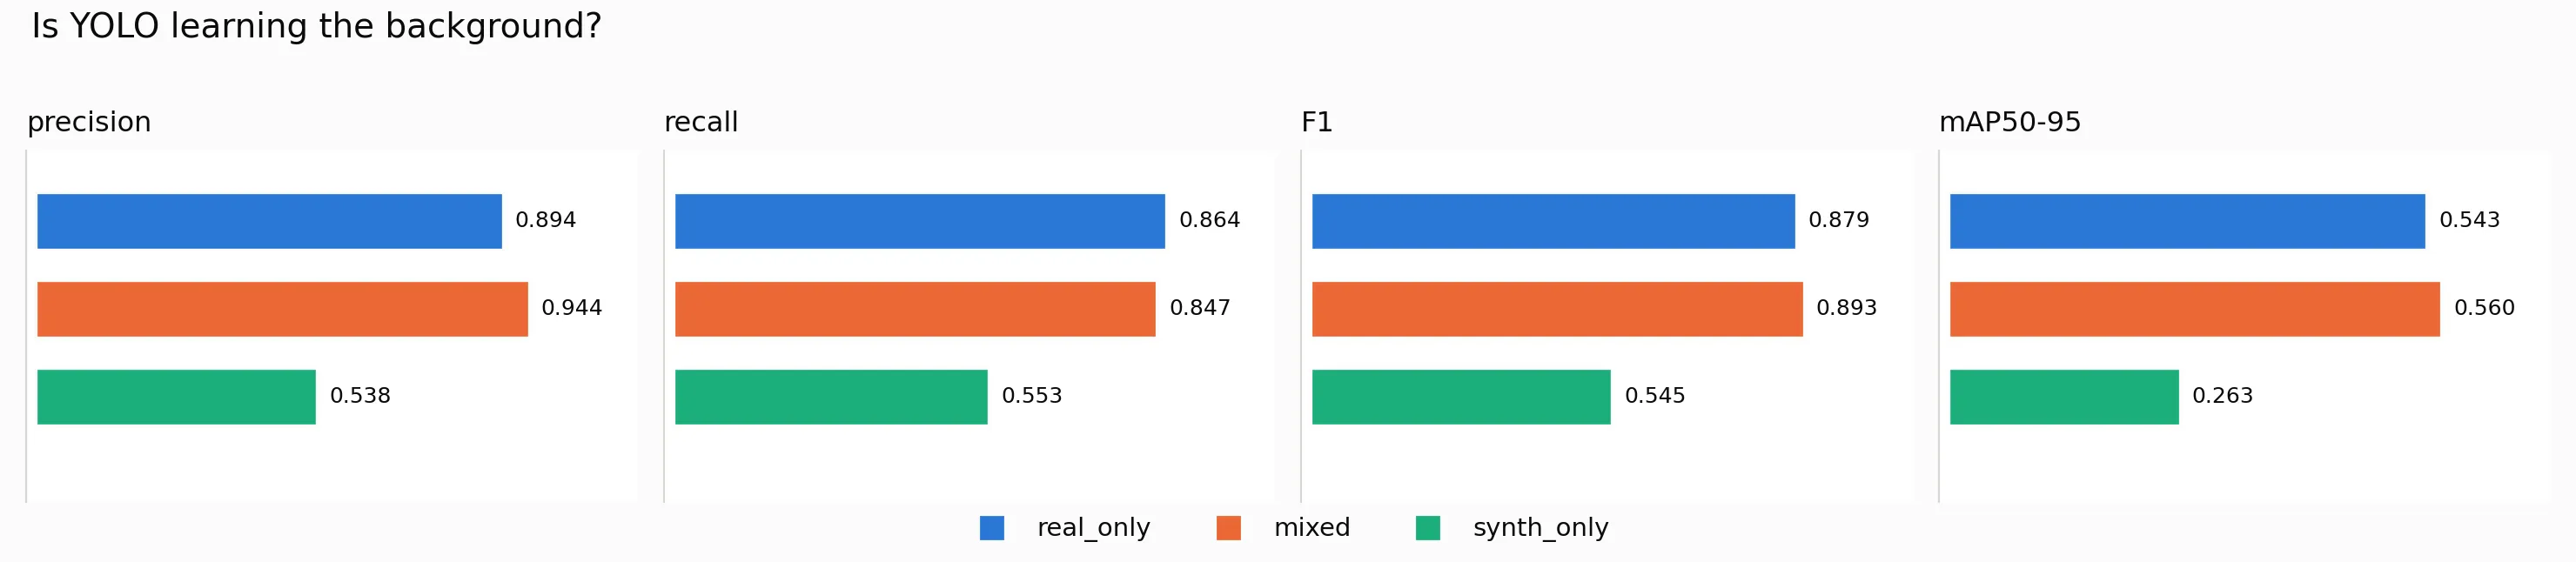
Since mixed sees ~1.7x more frames, it’s more fair to compare at earlier epoch steps:
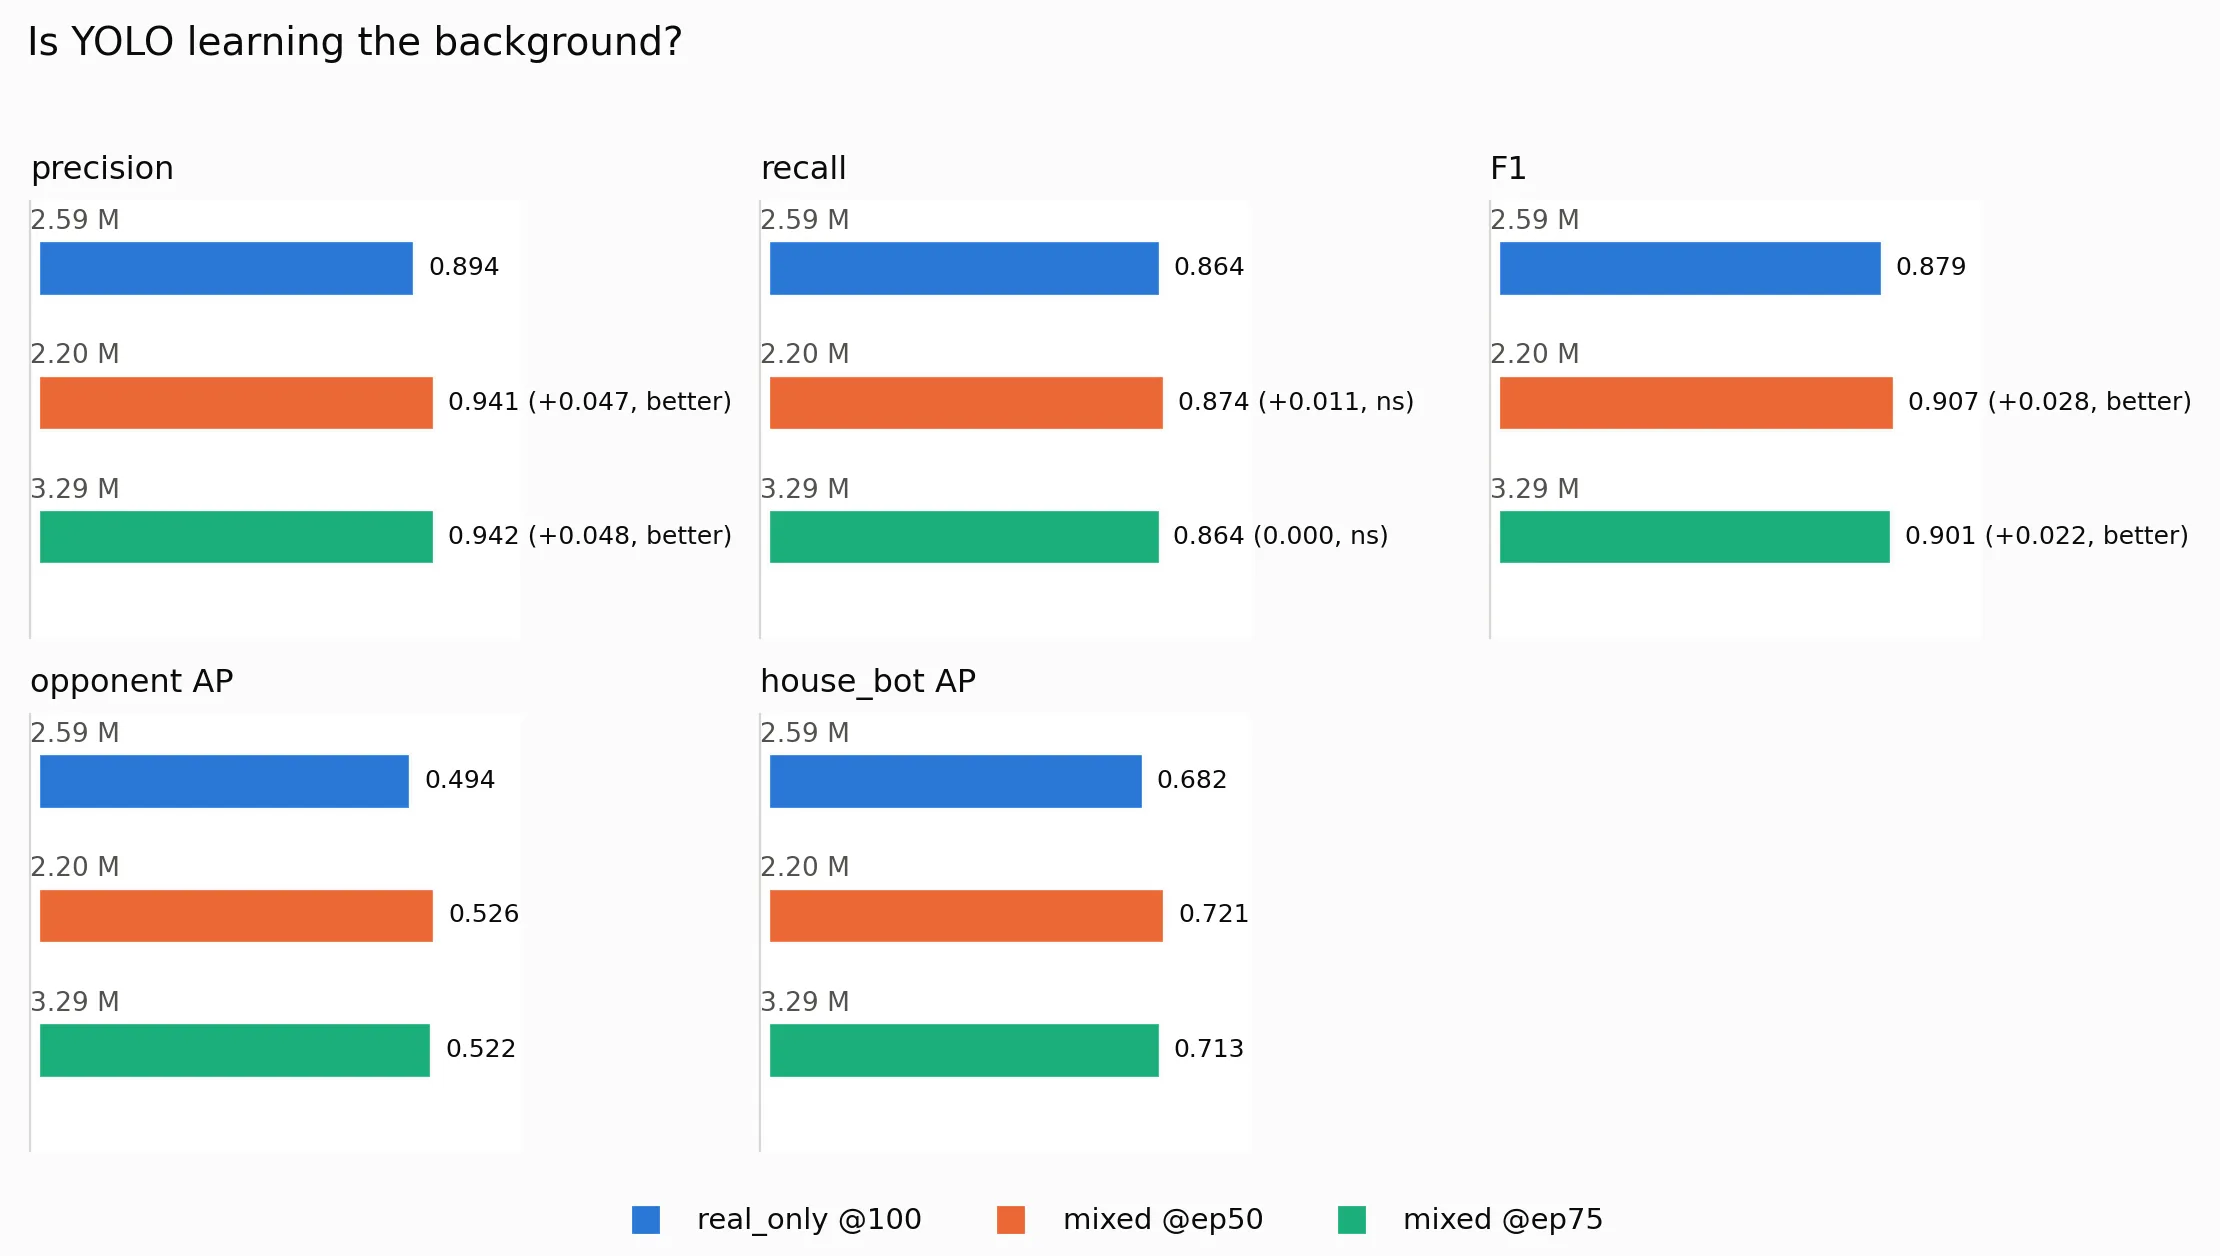
Even at 50 epochs, mixed still comes out on top over real_only for precision but is still within
noise for recall. +0.05 for precision may also still be within noise for run-to-run variance.
In the next section, I demonstrate that this amount of noise is expected. So adding synthetic data
doesn’t significantly improve results. Why?
To really test what the model is learning, I ran some “cut and paste” tests. This test transplants ground truth bounding box data onto other ground truth images and measures how the model confidence changes. I also test what happens when the robot is blurred out. Here’s a sample of the cut paste data used:
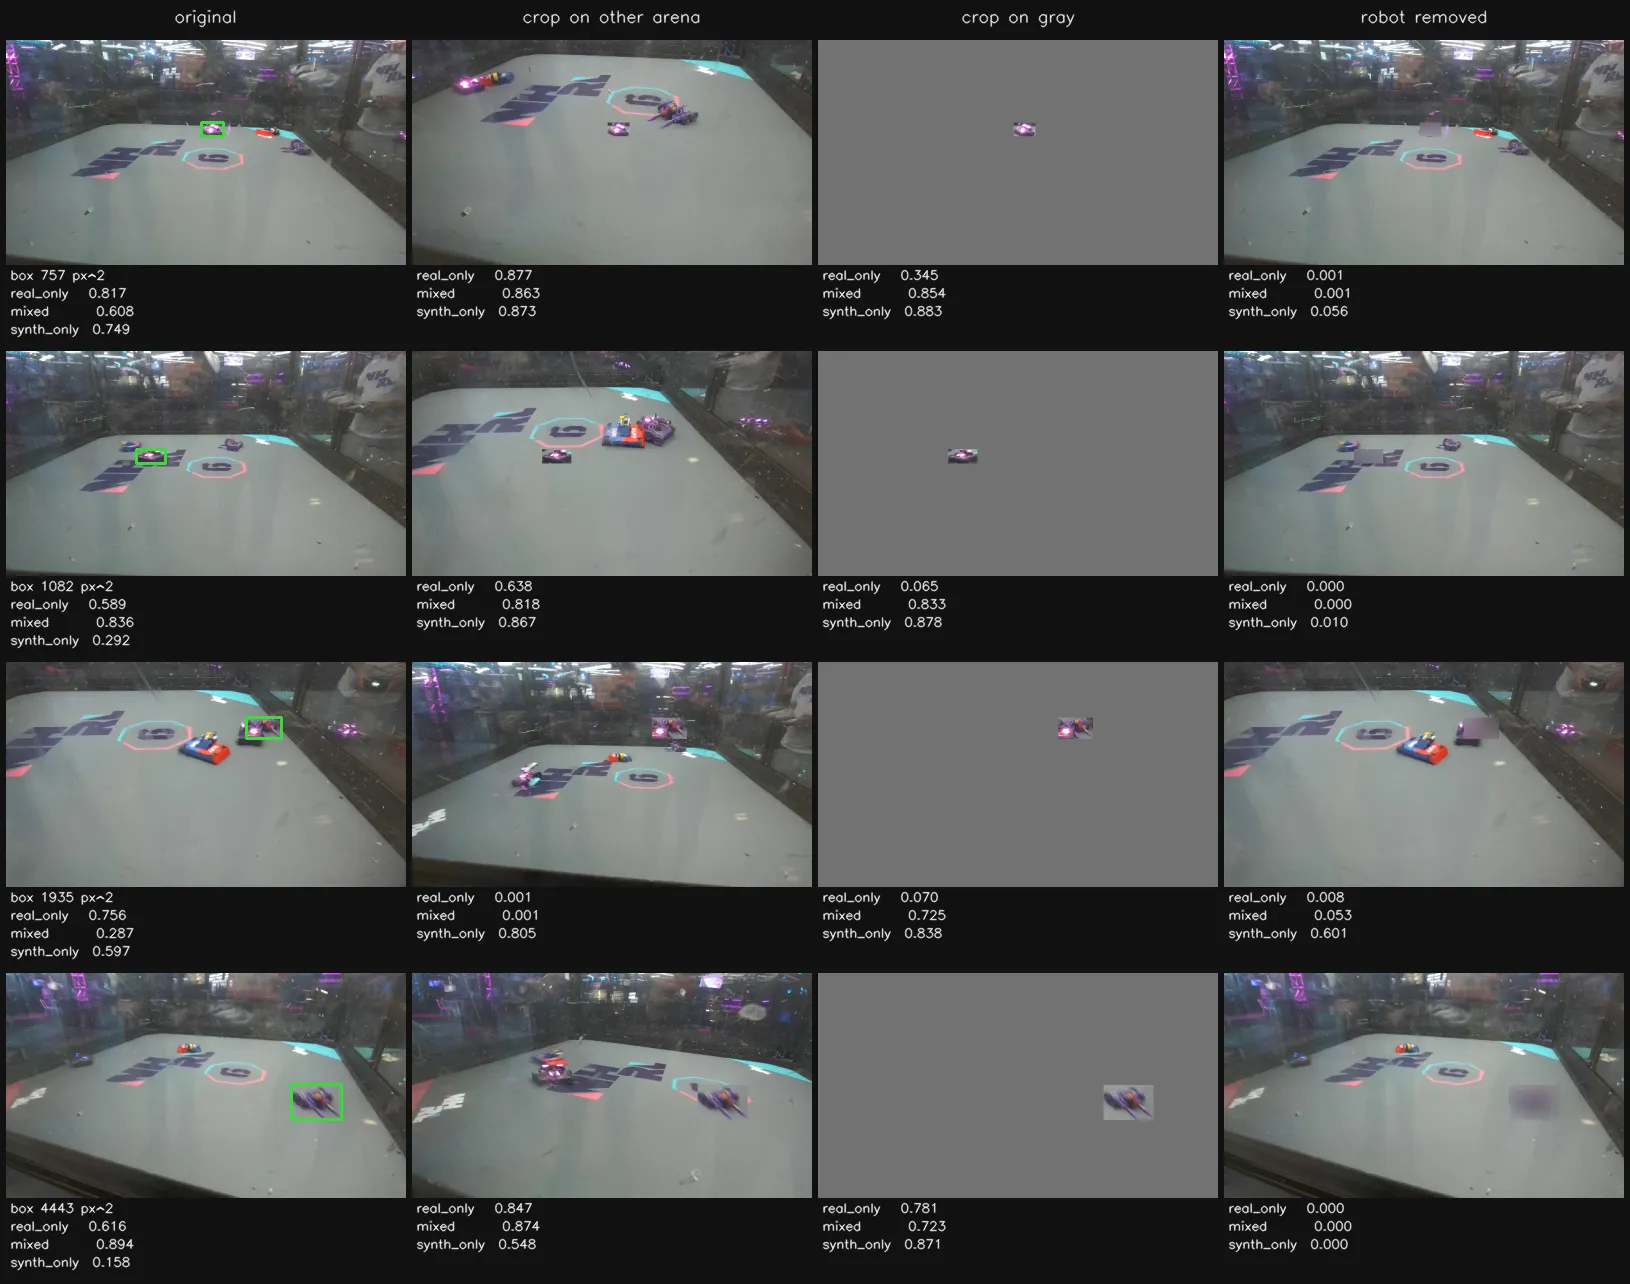
I made a script that measured model average confidence over the test data under the following conditions:
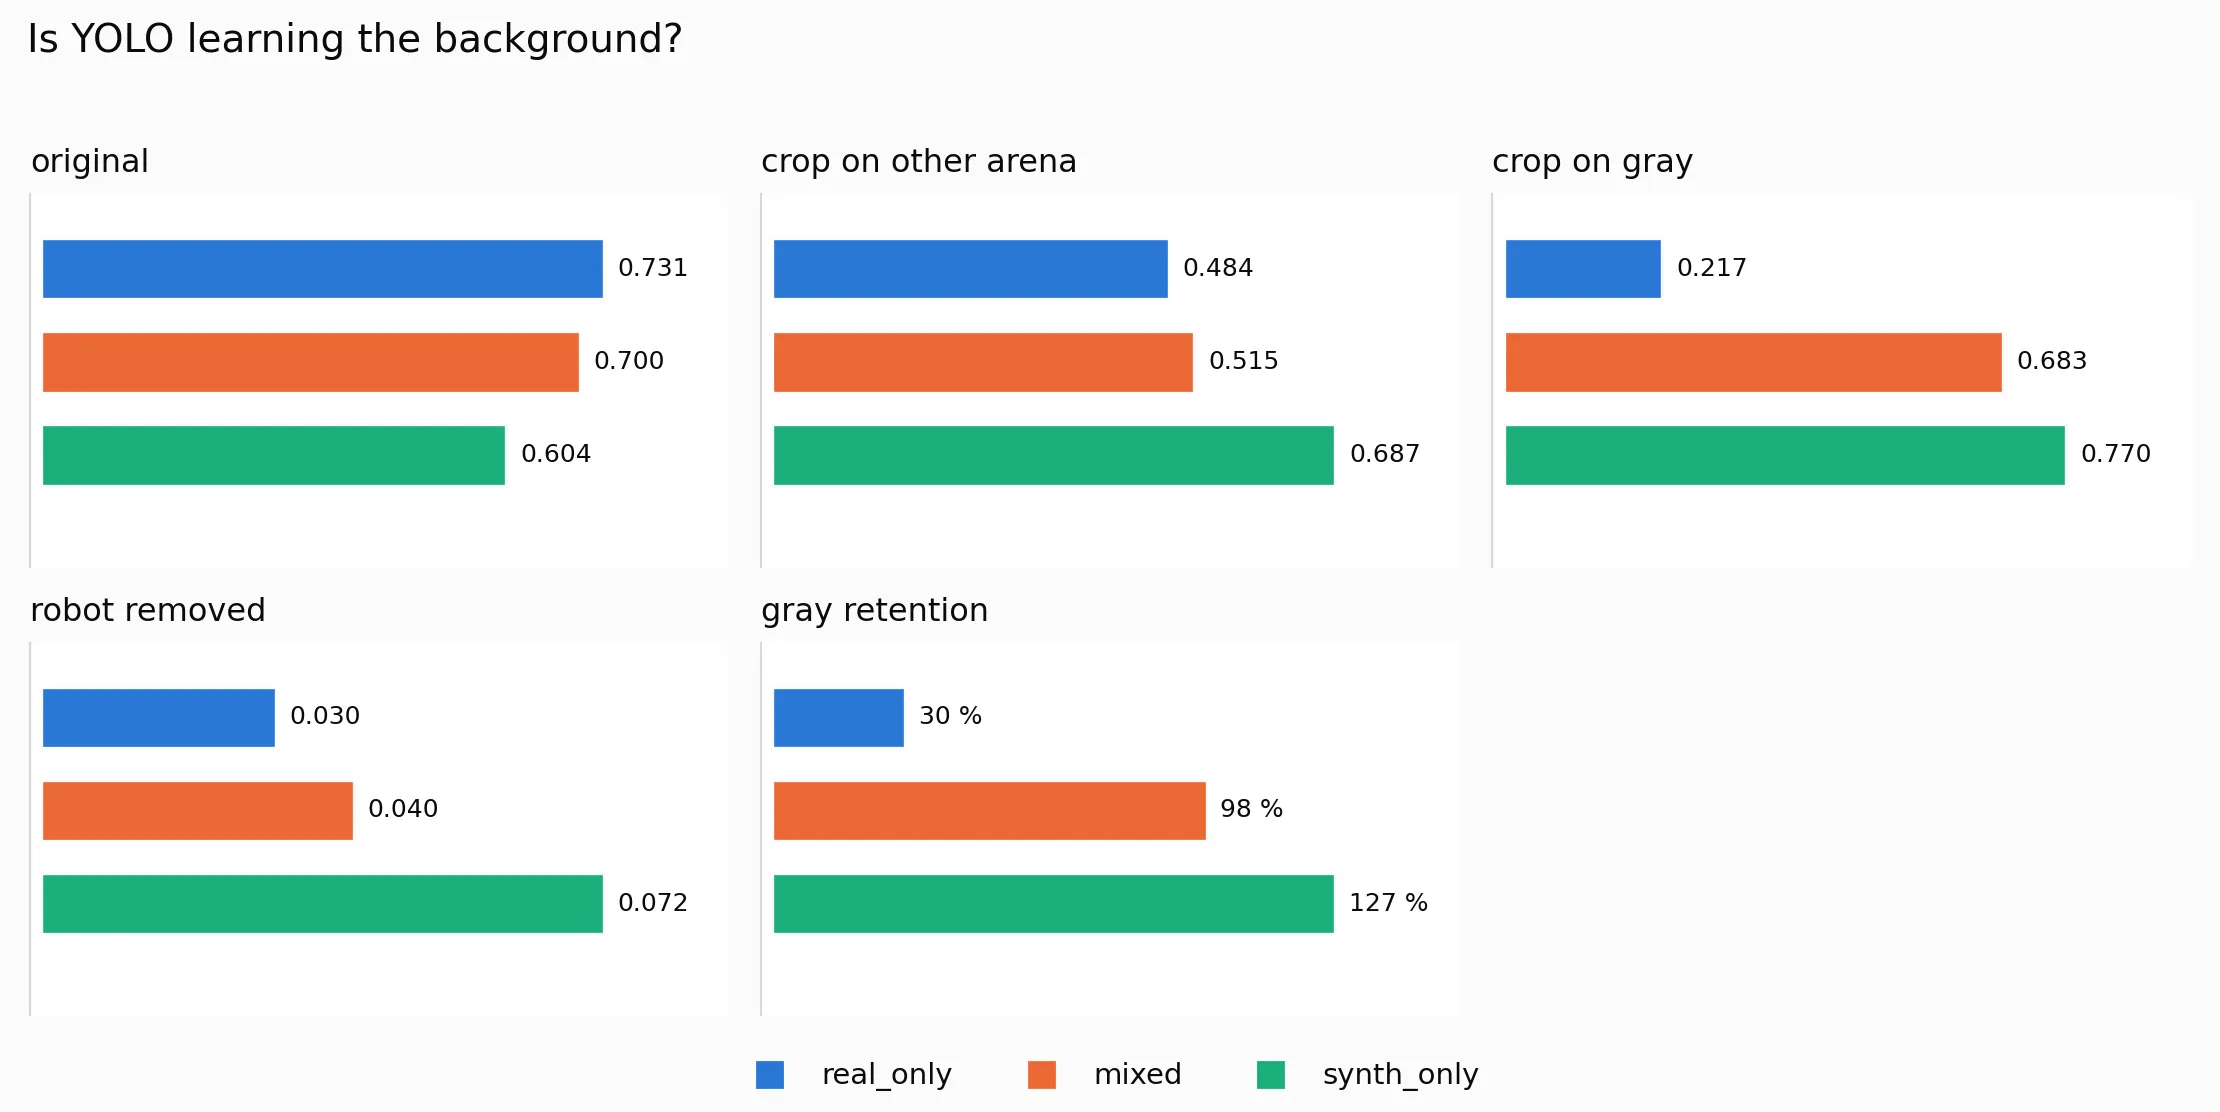
- Original: unmodified test data set image
- Crop on other arena - cut and paste bounding box into another test data image
- Crop on gray - cut and paste bounding box into gray background
- Robot removed - the original image with bounding box contents blurred out
“Gray retention” is the average confidence score of “crop on gray” divided by “original” (ex. 0.217 / 0.731 = 30% gray retention)
- ~0% - the model is context driven. The robot’s pixels carry no value in the detection.
- ~30% - the surroundings carry ~70% of the evidence
- ~100% - the surroundings contribute essentially nothing.
- >100% - adding surroundings actively hurts the model.
For synthetic-only models, real NHRL cages are out of distribution so its performance got worse.
This was puzzling but then I compared “gray retention” based on box sizes. I selected 100 random samples from the results (25 from each pixel size bucket) to compare:
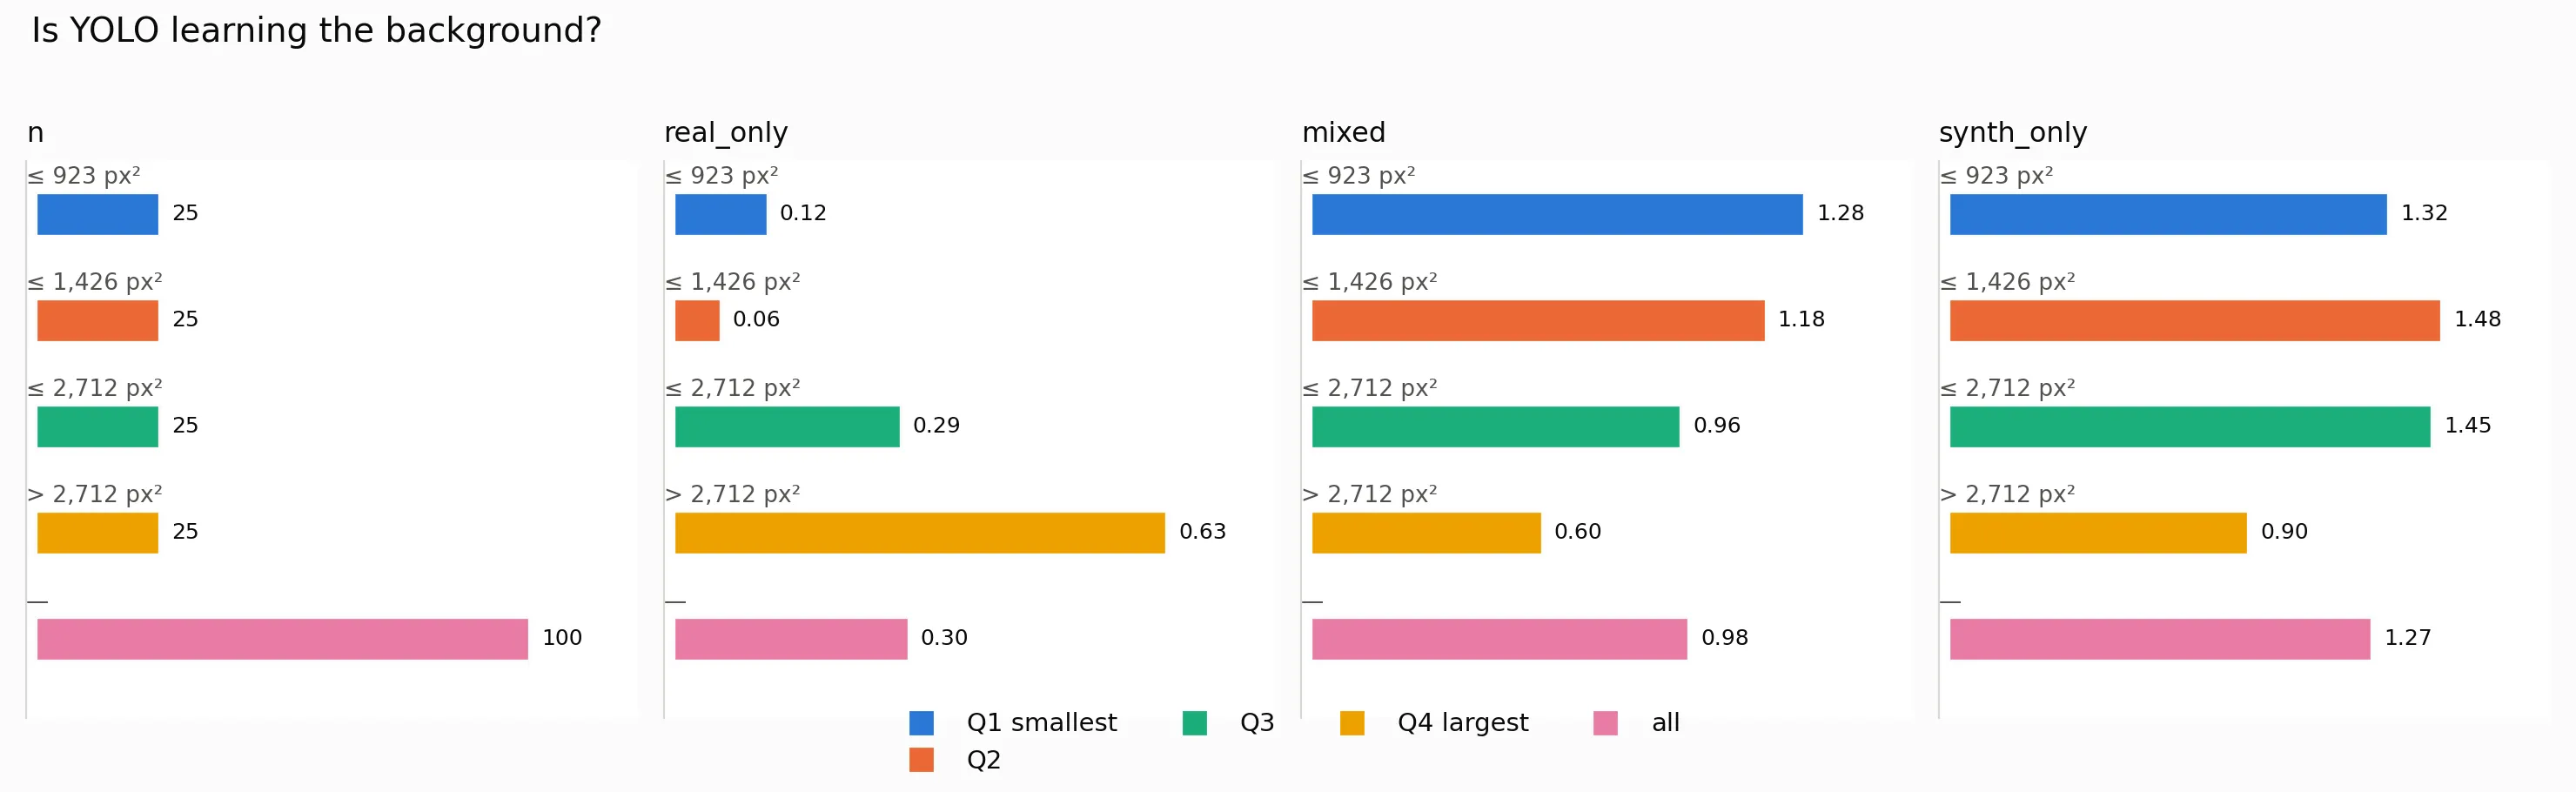
From this result we can conclude that the 75% of boxes (all less than Q4) are dragging the confidence down.
For distant robots, real_only is almost entirely context driven. Adding the synthetic dataset
sharpens the model’s ability to identify appearance at this distance.
In the process I learned that a small percentage of my dataset had labeling errors. I will go over these errors in a later section. The results shown here are with the corrected dataset.
Conclusion
From this I decided to keep the two models separate. An issue I presently have is I can’t collect tons of keypoint data. I use my SegmentFlow data labeling tool to get bounding box data. I detailed how this tool works in the previous post.
It seems that a large proportion of real data is needed for a model to generalize what an NHRL robot looks like. Synthetic data does improve the results but not without real data. Until I can generate tons of keypoint data (on a hobbyist budget), I have to keep the two models separate.
Which direction is “forward” on an NHRL robot isn’t entirely clear either. For disk shaped robots or ones where there are weapons on both sides, it’s not obvious unless you ask the driver which way they’ve mapped to “forward”. So I’m not convinced a model would be able to generalize this in a useful way.
Luckily TensorRT supports running multiple models in parallel. Implementing this feature got my latency deficit back.
Relevant reports:
- meshy_grade
- synthetic_arms_2026-07-31
How many epochs?
Training yolo-seg at 500 epochs with 35000 images can take almost 3 days. Switching to bounding box halved that, but I wondered if training time could be reduced further. I have thoughts about possibly learning the robots we’re going to fight that day and retraining the model before the fight. This isn’t quite in reach because I still need to manually label images, but being able to iterate on model training is always a win.
I ran this experiment before I corrected the dataset, but that doesn’t invalidate the results since I was testing for relative performance changes. My first set of experiments had a flaw in that the validation data contained 30% synthetic data. The ground truth dataset doesn’t have any synthetic data. Later experiments solve this.
Here’s the dataset composition for this round:
| split | frames | real frames | synthetic frames | synthetic share |
|---|---|---|---|---|
| train | 49086 | 32089 | 16997 | 34.6 % |
| val | 5454 | 3529 | 1925 | 35.3 % |
| total | 54540 | 35618 | 18922 | 34.7 % |
Here’s the results of the model scored on the ground truth dataset:
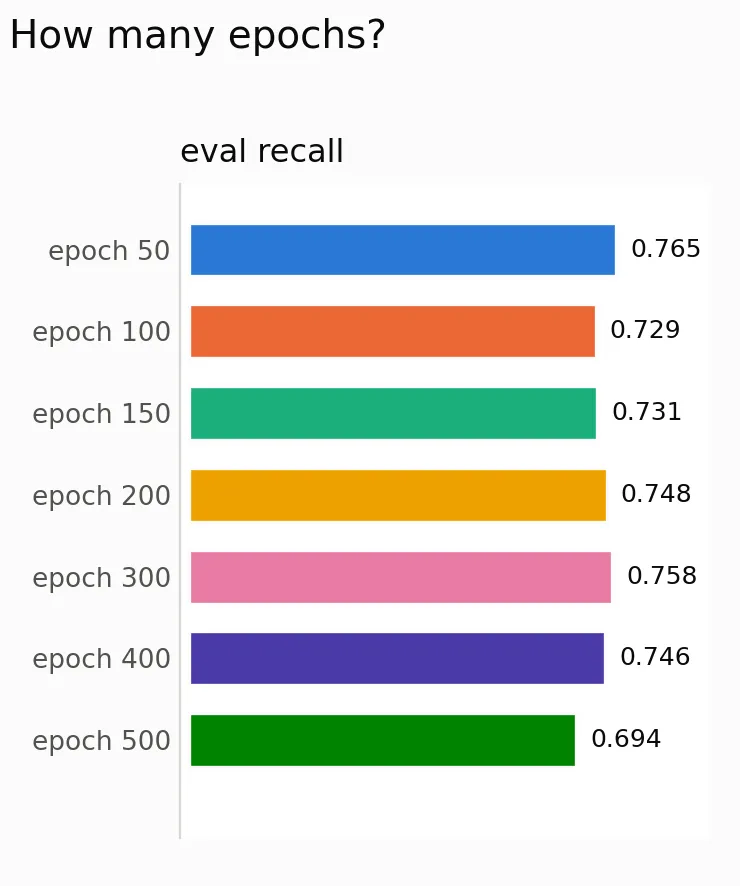
| epoch | eval recall | Δ vs base 0.742 | recall 95% CI | precision | F1 | δ-gate |
|---|---|---|---|---|---|---|
| 50 | 0.765 | +0.023 | [+0.002, +0.047] | ns | ns | better |
| 100 | 0.729 | −0.013 | [−0.035, +0.010] | ns | ns | better |
| 150 | 0.731 | −0.011 | [−0.035, +0.011] | ns | ns | better |
| 200 | 0.748 | +0.006 | [−0.014, +0.024] | ns | ns | better |
| 300 | 0.758 | +0.017 | [−0.002, +0.034] | ns | ns | better |
| 400 | 0.746 | +0.004 | [−0.007, +0.014] | ns | ns | better |
| 500 | 0.694 | −0.048 | [−0.069, −0.028] | ns | worse | worse |
I had close_mosaic=10 in my training script. This disabled the mosaic data augmentation Ultralytics applies
in the last 10 epochs. From this result, it seems the model is over-fitting. 500 epochs is definitely too much. Here’s a sample of what the input to YOLO looks like during training.
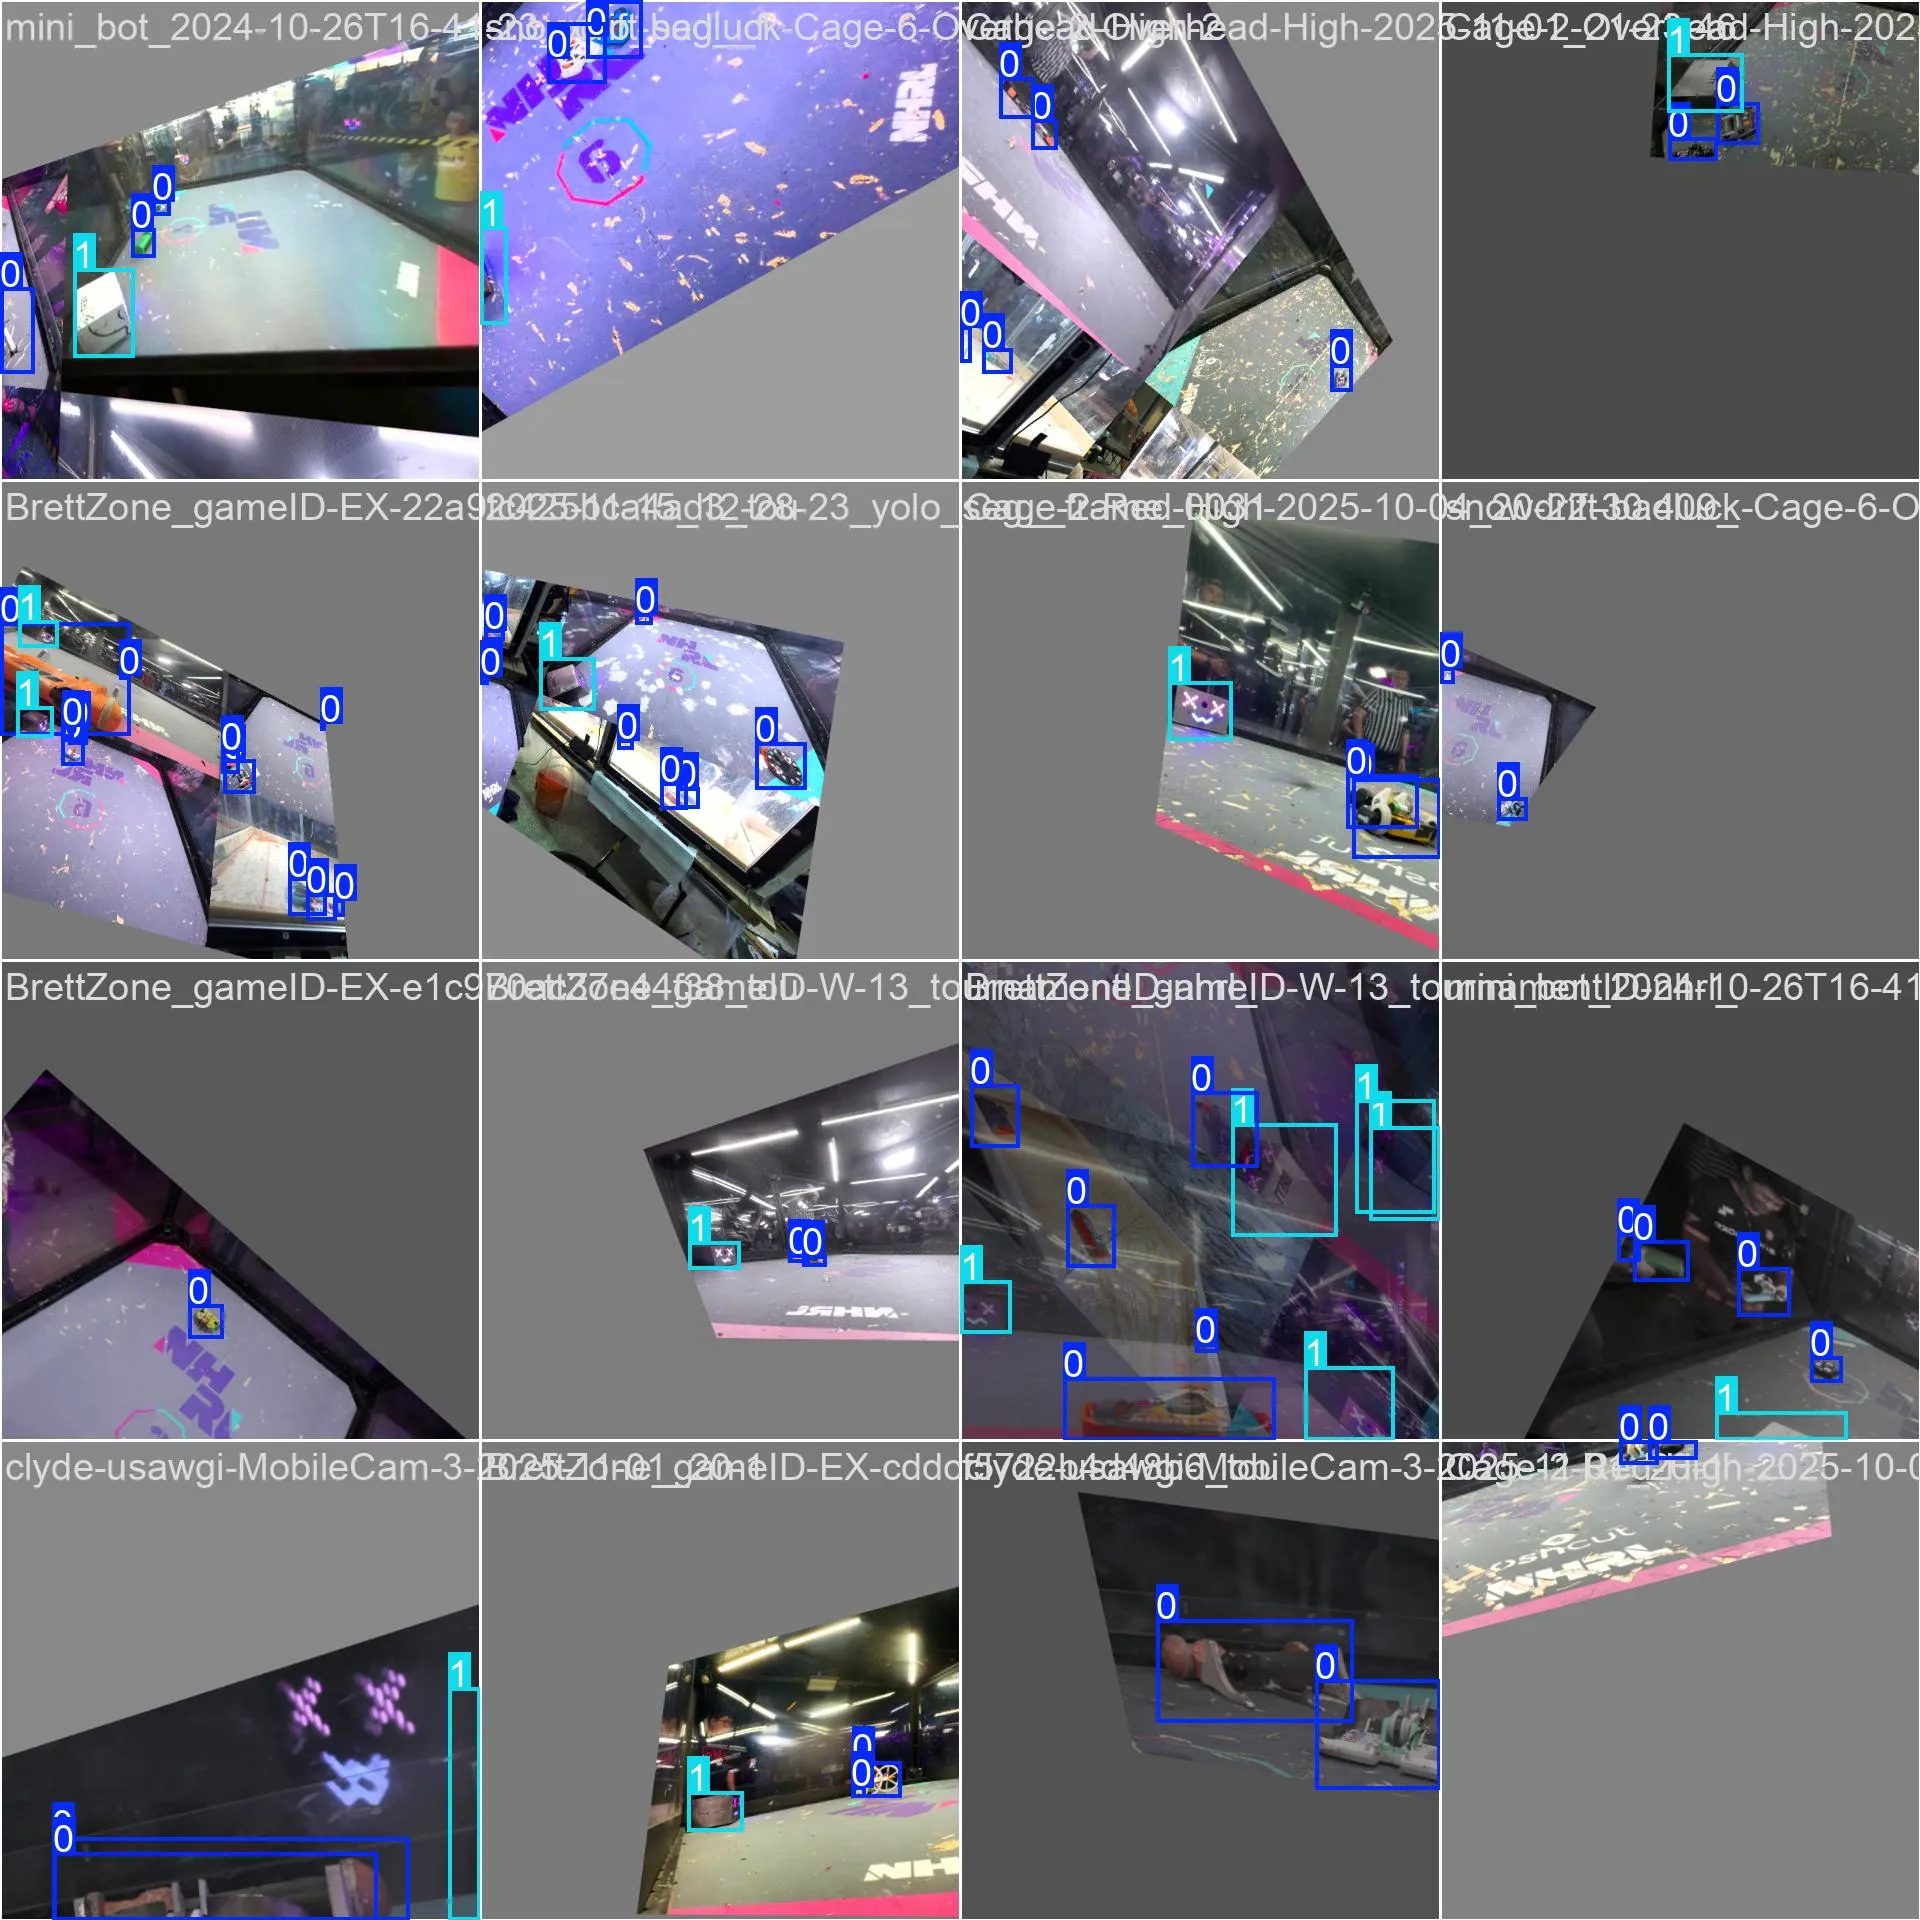
As you can see the images are skewed, warped, rotated, even overlayed on top of each other. These
transformations are called “augmentations”.
This is an attempt to prevent YOLO from memorizing the training data. IF the model memorizes the
training data, it will fail to generalize to new data. The “mosaic” augmentation combines multiple
training images into a mosaic and treats it as a single image. close_mosaic=10 disables this augmentation
in the final 10 epochs. I believe this is an attempt to get the model to fine tune as it finishes training with a low learning rate.
I also tried specifying fewer epochs:
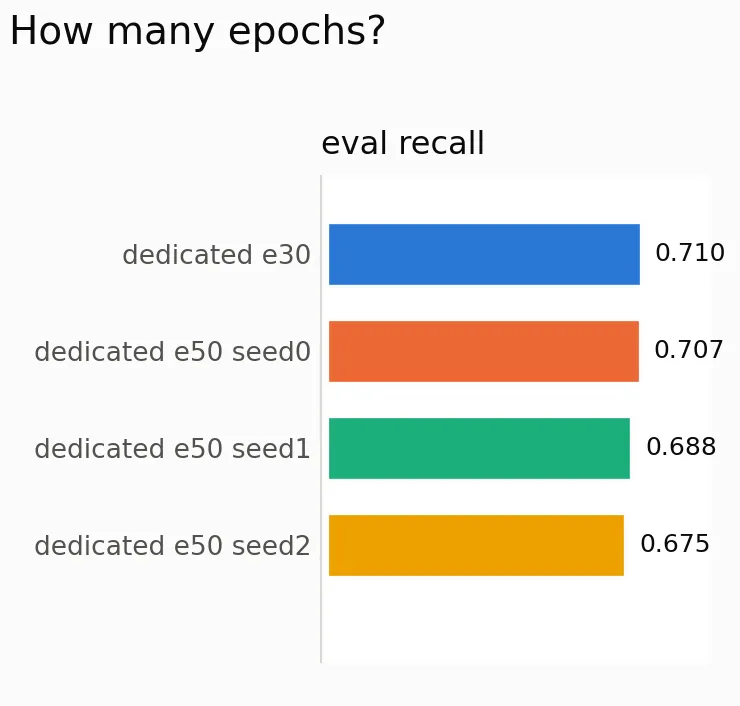
| run | eval recall | Δ vs base | recall 95% CI | δ-gate |
|---|---|---|---|---|
| dedicated e30 | 0.710 | −0.032 | [−0.056, −0.006] | worse |
| dedicated e50 seed0 | 0.707 | −0.035 | [−0.061, −0.011] | worse |
| dedicated e50 seed1 | 0.688 | −0.054 | [−0.078, −0.030] | worse |
| dedicated e50 seed2 | 0.675 | −0.066 | [−0.091, −0.041] | worse |
While training, Ultralytics decreases the learning rate parameter over the course of the training.
I use a linear decay. This result tells me the learning rate needed tuning. I also disabled
close_mosaic in future runs.
Start from the default checkpoint or from my own checkpoint?
For the next round, I trained with no synthetic data. This was before I corrected all the dataset errors however.
| split | frames |
|---|---|
| train | 32498 |
| val | 3609 |
| total | 36107 |
I ran a max of 150 epochs. I decided the epoch cut off based on recall compared to the May baseline. If recall is no worse than -0.04, that number of epochs is acceptable. I chose 0.04 because that seems to be the noise floor for run-to-run variance.
I also took the opportunity to see what happens when I train off of my own checkpoint when new dataset is introduced.
For the dataset train/val split, I cut based on scene instead of uniform random.
I used this script to cut the dataset based on date:
split_by_scene.py --mode temporal --cutoff 2025-11 --holdout-frac 0.2 --stratify-class robot,house_bot
old is data before the cut off, new is after. hold_ is the portion set aside for validation.
This is to simulate me labeling a bunch of new data and retraining the model.
| group | scenes | frames | share |
|---|---|---|---|
old | 20 | 14464 | 40.1 % |
new | 21 | 14207 | 39.3 % |
hold_old | 8 | 3893 | 10.8 % |
hold_new | 10 | 3543 | 9.8 % |
Note: old and new don’t share images. old+new were merged for some of the trainings in this section.
Using these data splits, I staged the following experiment runs:
| run | started from | trained on | classes | lr0 | wall-clock | file tag | plan ID |
|---|---|---|---|---|---|---|---|
R1 — from scratch, old only | COCO yolo26n.pt | old (14464 frames) | 4 | 0.01 | 1.38 h | base4 | 1 |
| R2 — fine-tune | R1’s ep100 | old+new (28671) | 5 | 0.001 | 2.72 h | warm5 | 2 |
| R3 — from scratch (control) | COCO yolo26n.pt | old+new (28671) | 5 | 0.01 | 2.73 h | cold5 | A |
| R6 — fine-tune, LR 0.01 | R1’s ep100 | old+new (28671) | 5 | 0.01 | ~2.7 h | warm5lr01 | 2b |
R4 and R5 are with some synthetic data reintroduced. I didn’t add enough so the results aren’t worth discussing.
I saved every 25 epochs and scored each one on the ground truth data:
| run | ckpt | recall Δ [95% CI] | precision Δ | F1 Δ | gate |
|---|---|---|---|---|---|
| R2 fine-tune | ep75 | +0.085 [+0.062, +0.109] | +0.002 ns | +0.052 | better |
| R2 fine-tune | ep100 | +0.072 [+0.048, +0.094] | +0.007 ns | +0.047 | better |
| R2 fine-tune | ep125 | +0.016 [−0.008, +0.039] ns | +0.015 better | +0.016 ns | better |
| R2 fine-tune | ep150 | −0.056 [−0.083, −0.030] | +0.023 better | −0.029 worse | worse |
| R3 from scratch | ep75 | +0.100 [+0.075, +0.127] | −0.027 worse | +0.049 | worse |
| R3 from scratch | ep100 | +0.092 [+0.068, +0.117] | −0.006 ns | +0.053 | better |
| R3 from scratch | ep125 | +0.028 [+0.003, +0.055] | +0.008 ns | +0.021 | better |
| R3 from scratch | ep150 | −0.088 [−0.116, −0.059] | +0.022 better | −0.052 worse | worse |
| R6 fine-tune, LR 0.01 | ep100 | +0.071 [+0.047, +0.094] | +0.007 ns | +0.046 | better |
| R6 fine-tune, LR 0.01 | ep150 | −0.056 [−0.083, −0.030] | +0.023 better | −0.029 worse | worse |
For reference, here’s the scores of the baseline model. It’s not directly comparable since they were trained on different sets but it’s still a helpful comparison.
| view | recall | precision | F1 | mAP50-95 |
|---|---|---|---|---|
| full taxonomy, agnostic | 0.742 | 0.962 | 0.838 | 0.504 |
| new-class (mrs_buff_mk3 only) | 0.677 | 0.900 | 0.773 | 0.452 |
There are a lot of takeaways here. For a dataset of this size, 100 epochs is enough. Training from a checkpoint speeds up training slightly. This can save ~0.7 hrs.
For R3, I set learning rate to 0.01 to simulate continuing training from where it left off. This
got a similar result to the previous experiment where adding more epochs doesn’t help improve recall.
For future trainings, I set the lrf parameter in my training script to 0.1. This sets the floor value for the learning rate linear decay. It seems low learning rates don’t help much for this dataset.
In conclusion, ~100 epochs is good for a dataset of this size and training from a checkpoint has a small time save.
Relevant reports:
- data_epoch_min_phaseA_2026-07-24
- category_addition_2026-07-25
How much data do I need?
So far, I’ve been labeling data until I get tired of it. I wanted to know how many images produce diminishing returns. I ran this experiment after fixing all the dataset errors (before this report: synthetic_arms_2026-07-31).
Here’s the experiment parameters:
| corpus | nhrl_robots_bbox_2class, 31,465 frames, 56 scenes, human-validated |
| classes | robot (68,104), house_bot (24,347) |
| val | 9 scenes / 4,732 frames, scene-disjoint, identical across all arms |
| training pool | 47 scenes / 26,733 frames |
| schedule | cold from COCO, 100 epochs, lr0 0.01, lrf 0.1, degrees 45, flipud 0, close_mosaic 0 |
| ladder | ep{25, 50, 75, 100} scored per arm |
I ran these trainings:
| arm | scenes | frames | description |
|---|---|---|---|
| base100 | 47 | 26,733 | 100% of the dataset |
| scene75 | 37 | 21,159 | ~75% scenes included |
| rand75 | 47 | 20,049 | ~75% randomly sampled images included |
| scene50 | 24 | 13,670 | ~50% scenes included |
| rand50 | 47 | 13,366 | ~50% randomly sampled images included |
Experiment results scored on ground truth compared to the baseline:
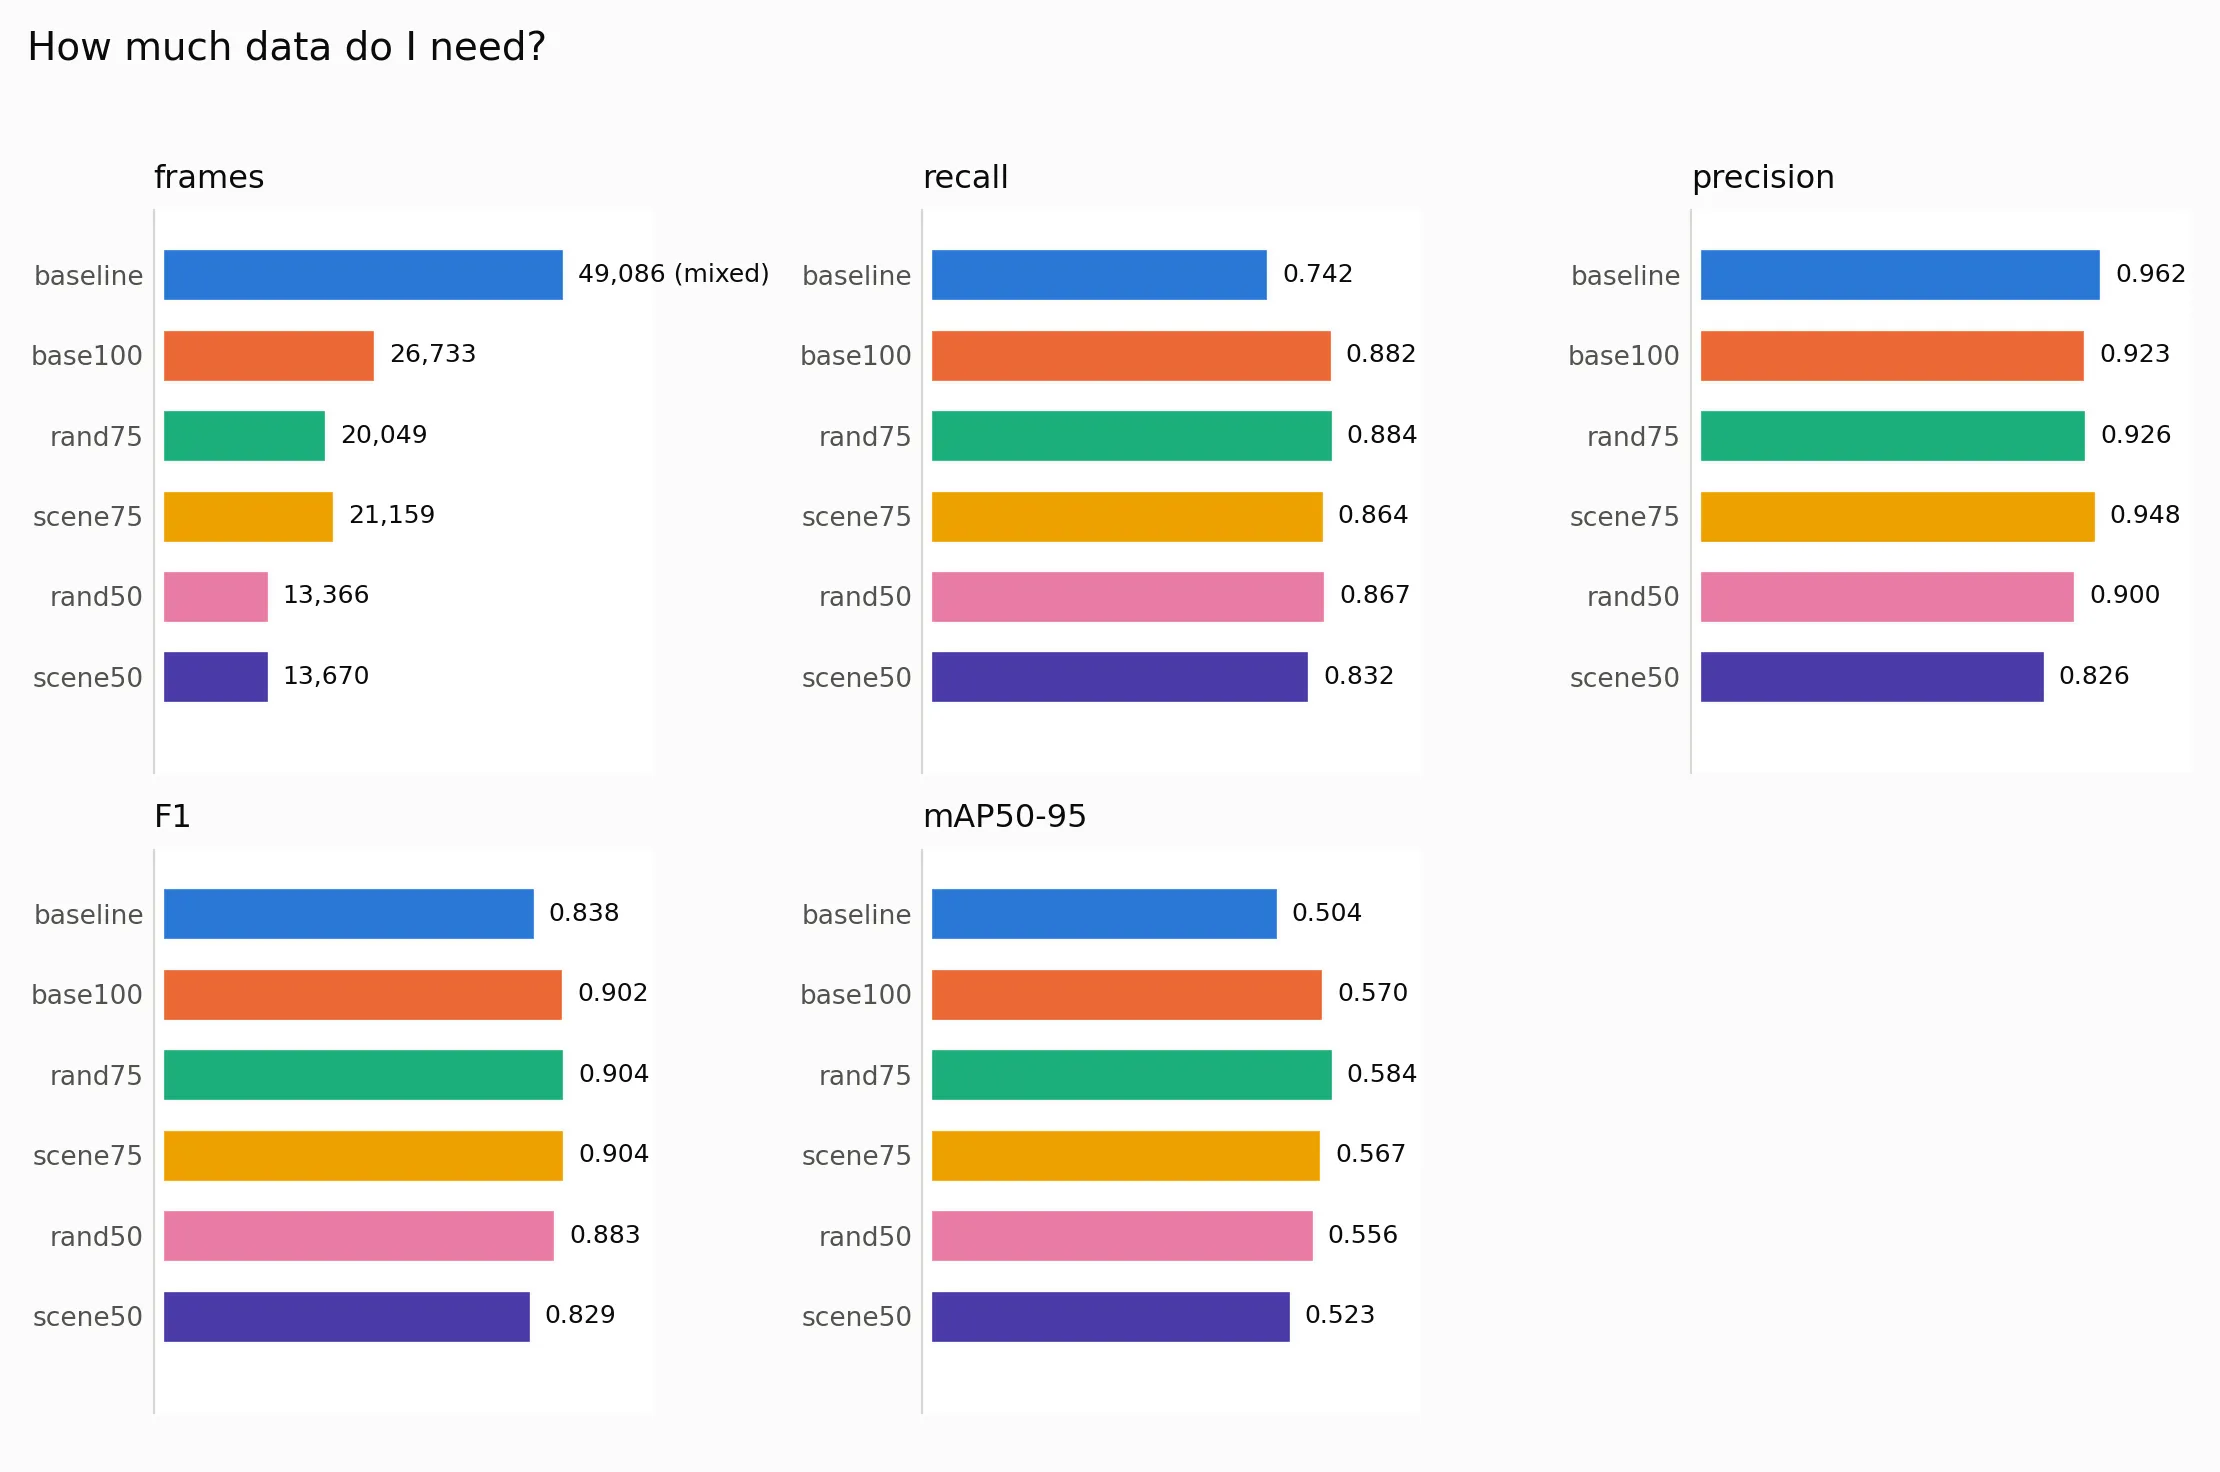
Conclusion: I need at least 20000 images. rand75 is roughly equivalent to training on the full
dataset. I need at least ~37 scenes. At ~24 scenes, the performance is noticeably worse. Still better
than the baseline but a full 0.05 points less.
My takeaway is I need to label fewer images per scene and sample more different looking scenes.
This experiment also reinforces that 50…100 epochs is the sweet spot for training.
Also of note: all of these models improved over the baseline significantly. Dataset hygiene is a huge factor in model performance. Going forward I will make sure to look at every image that’s used for training.
Relevant reports:
- data_scaling_2026-07-27
Dataset hygiene
After realizing that my dataset has issues. I revamped my dataset validation tools. Part of my hesitation to do it was the amount of time it takes. I sped up the process by showing multiple images at once. This allows me to scan over a batch quickly and pass/fail the whole batch or give a verdict on individual images.
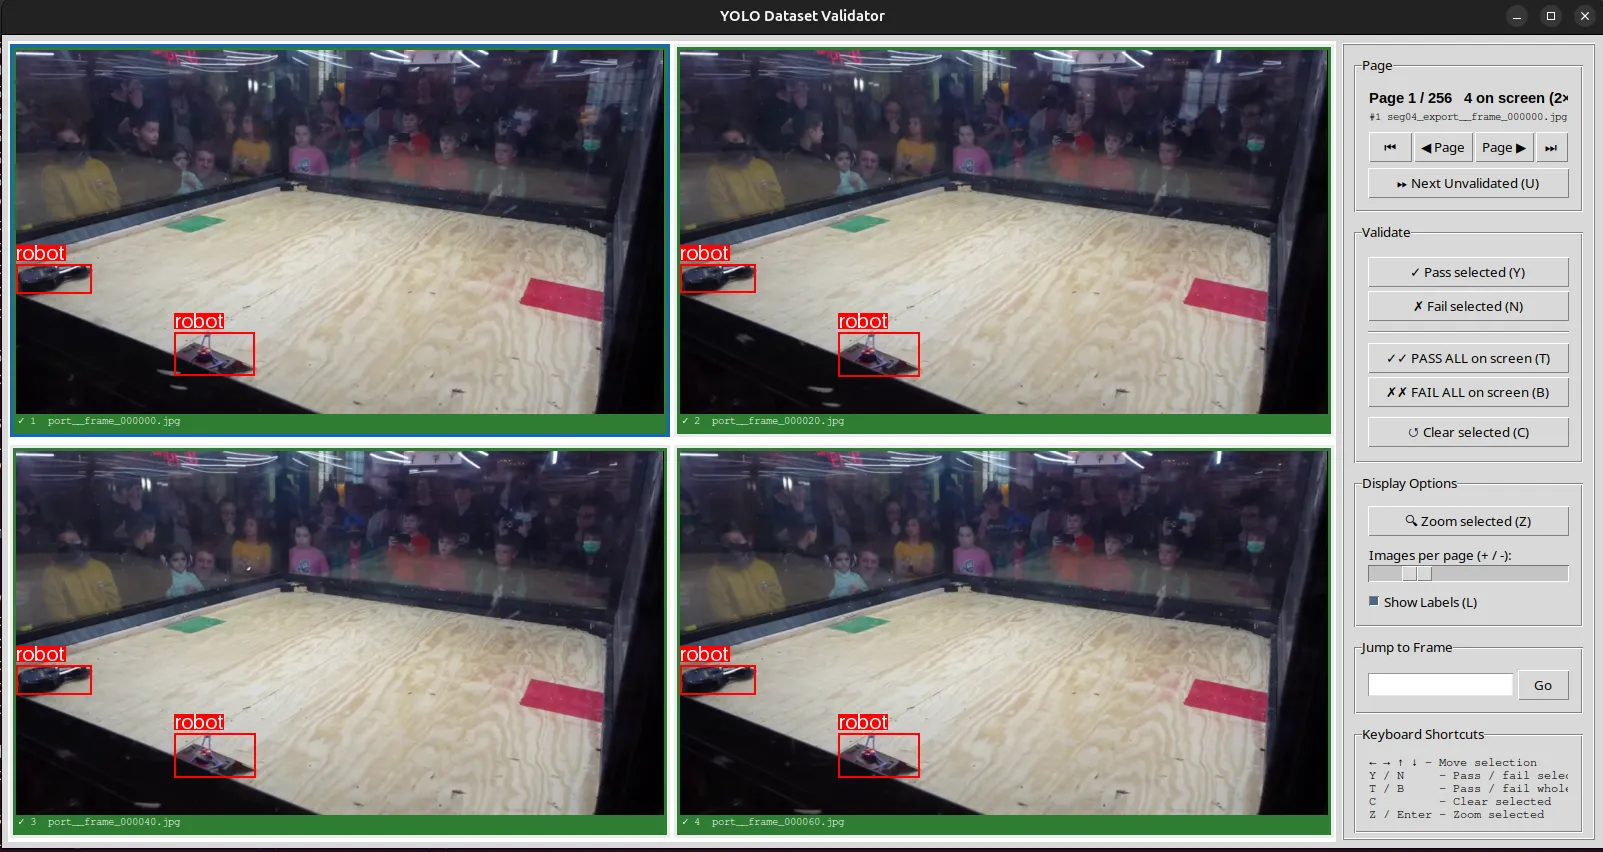
Since a lot of the failed images had other images in the same scene, I just deleted them from the dataset instead of fixing them.
Takeaways
Here are my takeaways from these experiments
Don’t use Meshy AI or CAD models for synthetic data if there’s no real data to back it up
Meshy models work only if the output render is actually a close visual match to the real robot or there’s real data to reinforce it. If there’s no real data, it fails if the render is poor or if the builder modified the robot. If I can collect massive amounts of keypoint data without labeling manually, this method will work for keypoints. Since I have this for bounding box data, it did slightly improve results for bounding box detection.
Keep using CAD models for synthetic data
CAD based synthetic renders work because they don’t have any visual hallucinations. I can also instruct our team not to change the design. Or when there are external design changes, I can retrain from the changed CAD.
Don’t combine bounding box and keypoints in one model
The keypoints model learns the specific robot appearance independent of context. The bounding box model is trying to generalize all NHRL robots.
Adding synthetic data does improve the model’s performance slightly and cut-paste tests show the model can be less environment dependent with synthetic data introduced, but combining with keypoints is still not the correct strategy.
Once I’ve figured out how to collect a massive amount of real keypoint data, I can better resolve this question.
Don’t split the opponent category by archetype
All robots look pretty different even within the same archetype so the model has a hard time learning the split. Also each archetype has wildly different amounts of data so some classes pollute the recall.
Don’t split the opponent category by individual robot
The class imbalance for each robot name causes all metrics to tank. The model also fails to generalize to new robots since they don’t match the appearance of any other robot.
Use bounding box model not segmentation
For bounding box metrics, the two models are nearly identical. Segmentation doesn’t improve localization much since I use the centroid for location. On desktop, the bounding box is 18% faster than the segmentation model.
When do I stop training YOLO? (what metric threshold do I need to satisfy baseline metrics requirements?)
~100 epochs seems to be enough. At this point, recall and precision are within the noise of baseline with unseeded runs. The more important factor is learning rate. Setting the floor learning rate to 0.1 helped improve recall.
How many images do I need to label for a generalized NHRL robot model?
From the above experiments ~20,000 images. It helps to have more but below this number, image diversity starts to matter a lot more.
What had a much bigger impact was data hygiene. Scrubbing through the dataset, I noticed lots of errors. The conversion from segmentation to bounding box revealed there were lots of small polygons that broke the conversion. Synthetic data leaked into earlier experiments. I thought this was a problem until I reran the experiment with clean bounding box and synthetic data.
Going forward, I will validate all new images even ones that were validated in segmentation and go through bounding box conversion. If the dataset under goes any kind of modification or transformation, all images need to be revalidated. Grab 25% fewer frames per scene. They extend training time and don’t add much value.
For the bounding box opponent model, how much synthetic data of our robots do I need to mix in?
Introducing synthetic data improves faraway detections of robots. ~18,000 images was enough to see improvements. More experiments are required to get a specific number.
Is starting from a checkpoint better than cold start?
Yes, slightly. It saves ~25 epochs/45 min. More testing is required to see if different starting checkpoints affects results. A cold start is fine to comparable results for these experiments.
Working with AI
All of these experiments were managed by Claude. I learned to check every assumption before letting Claude run an experiment. It doesn’t know how to recognize faulty assumptions and will run with conclusions based on faulty data.
Having Claude watch long training sessions over SSH is not viable. It gives up after a few hours even after the SSH connection is still open. It can’t figure out how to maintain a watcher script over SSH. Claude needs to run local to the training to be an effective watcher. It was helpful to have some reassurance that the training was going to complete successfully even if the input assumptions were wrong. I’ve tried to queue up multiple jobs without AI and failed due to a path error and wasted several hours.
Overall, I will continue to use Claude to run these experiments. If I didn’t have this tool, I wouldn’t have run these experiments. They’re time consuming and require a lot of mundane scripting to match up labels, sweep training parameters, collect and parse results, and render graphs. I’m confident that as long as I look through all the data I’m providing and the scoring metrics, I won’t be led astray again.
Qualitative results
Visually the model looks like it’s performing better. For our 2nd fight in May with Sphinx, the model confused Mrs Buff MK3 with the opponent at key moments. That doesn’t happen anymore:
Next steps
Now in the remaining time I have before MassD, I’m looking into adding a Kalman filter to the model’s output to better fill in the gaps where the model drops out momentarily and maybe even look into more sophisticated control than PID.